statistics
2 designs
Showing 2 of 2 (2 total)
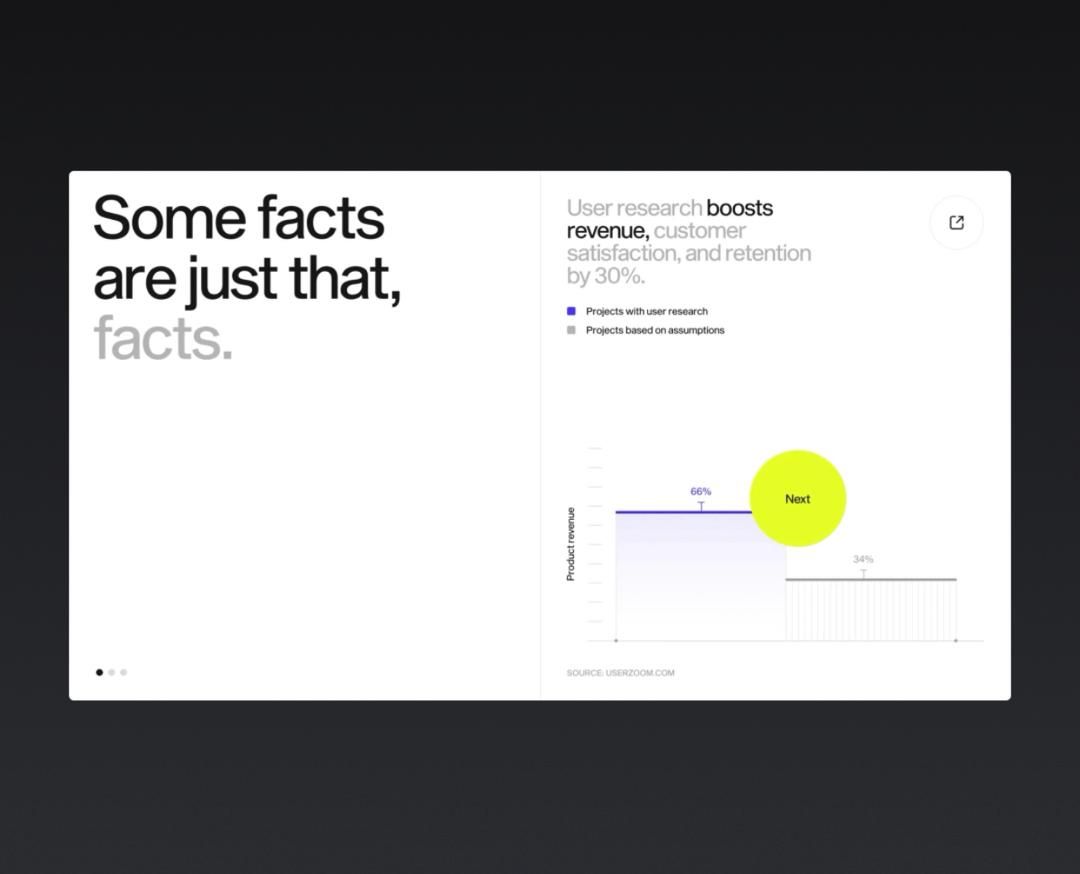
Presentation slide showcasing user research statistics with 30% improvement metric highlighted. Data-driven design with bright accent color and clear performance visualization.
presentation-slidedata-visualizationstatistics
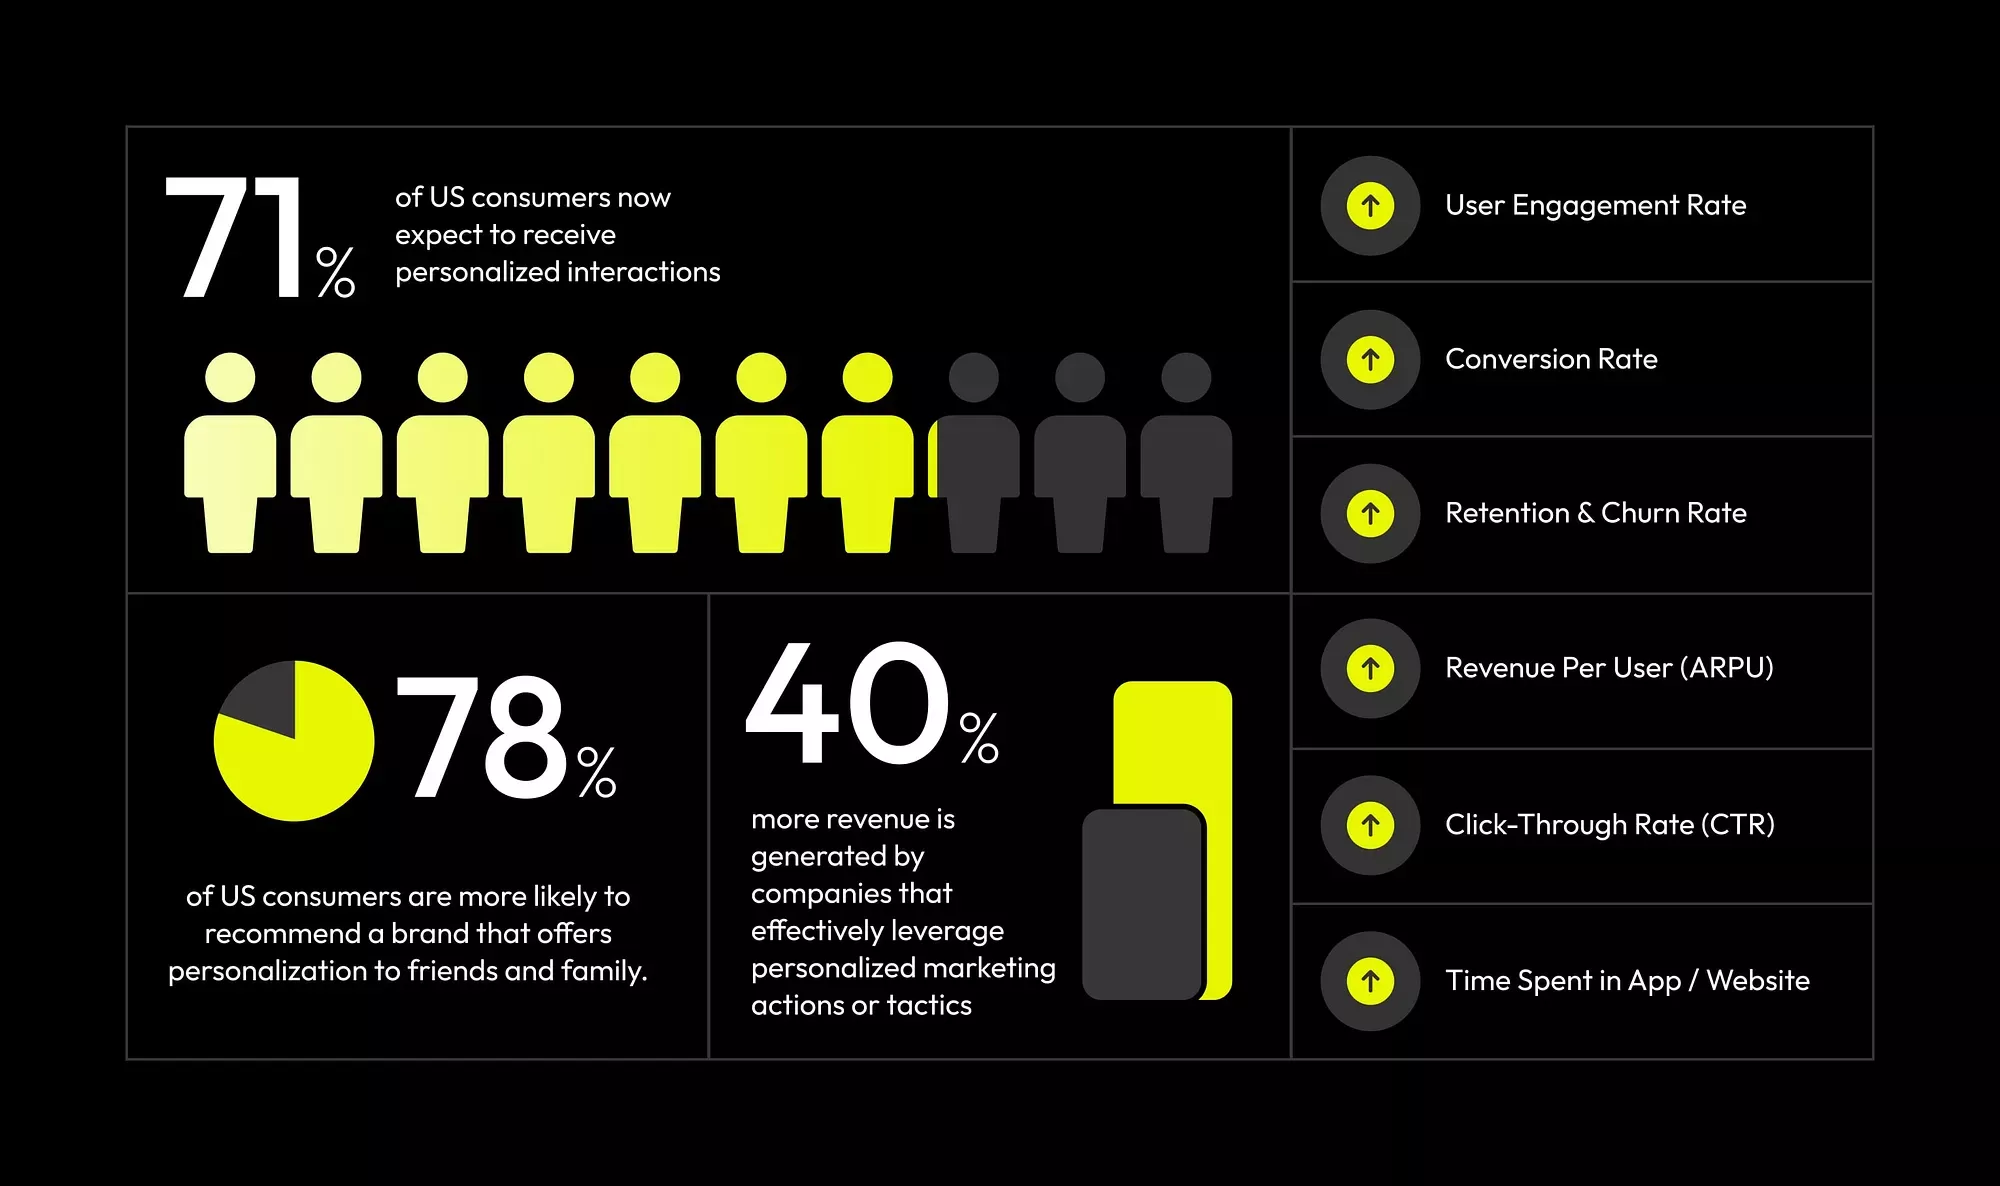
Data visualization and infographic design with bold yellow accent elements on dark background. Modern presentation layout combining statistics, icons, and visual metaphors to communicate personalization metrics effectively.
infographicdata visualizationstatistics