quantitative
9 designs
Showing 9 of 9 (9 total)
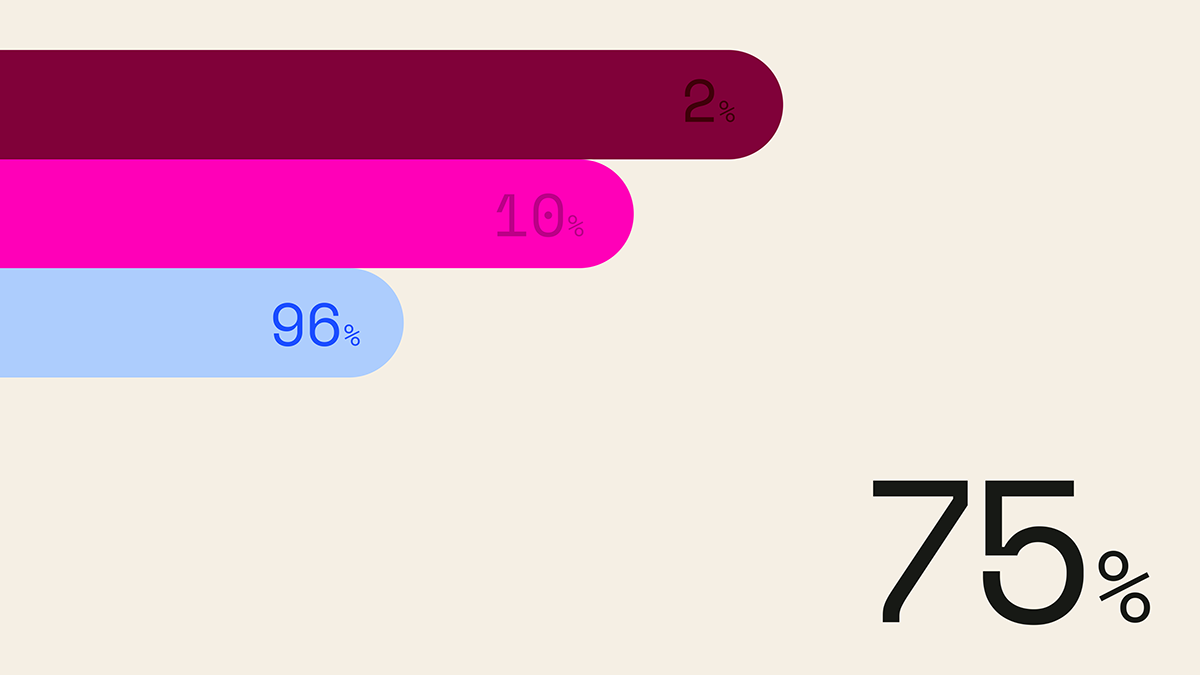
This is a clean, minimalist data visualization utilizing horizontal bars of varying saturation and length to represent percentages. The design relies on strong color contrast against a neutral background to clearly communicate quantitative information.
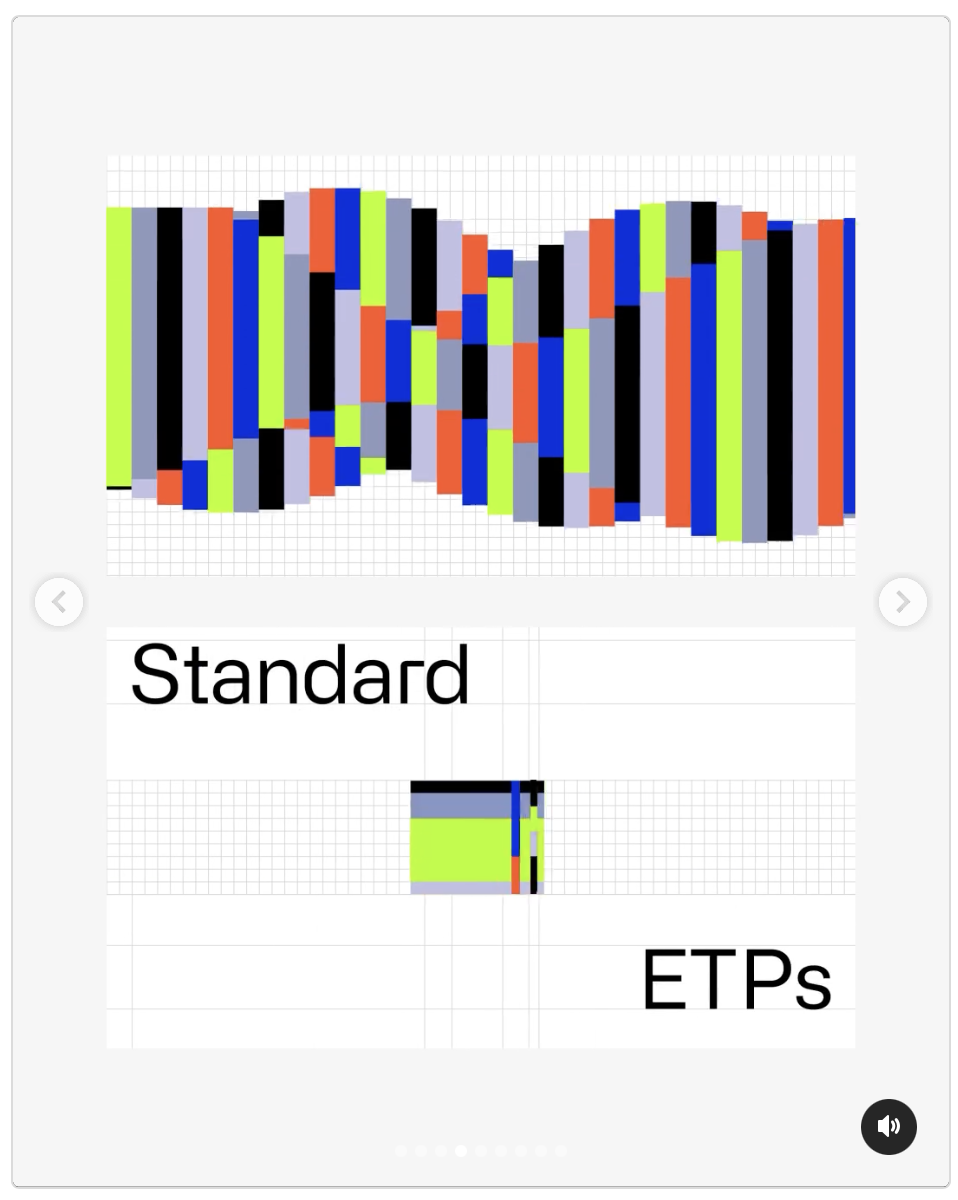
This image presents a clean, technical data visualization comparing two sets of metrics, 'Standard' and 'ETPs,' using a grid-based bar chart format. The design emphasizes clarity and quantitative comparison through distinct color coding and structured layout.
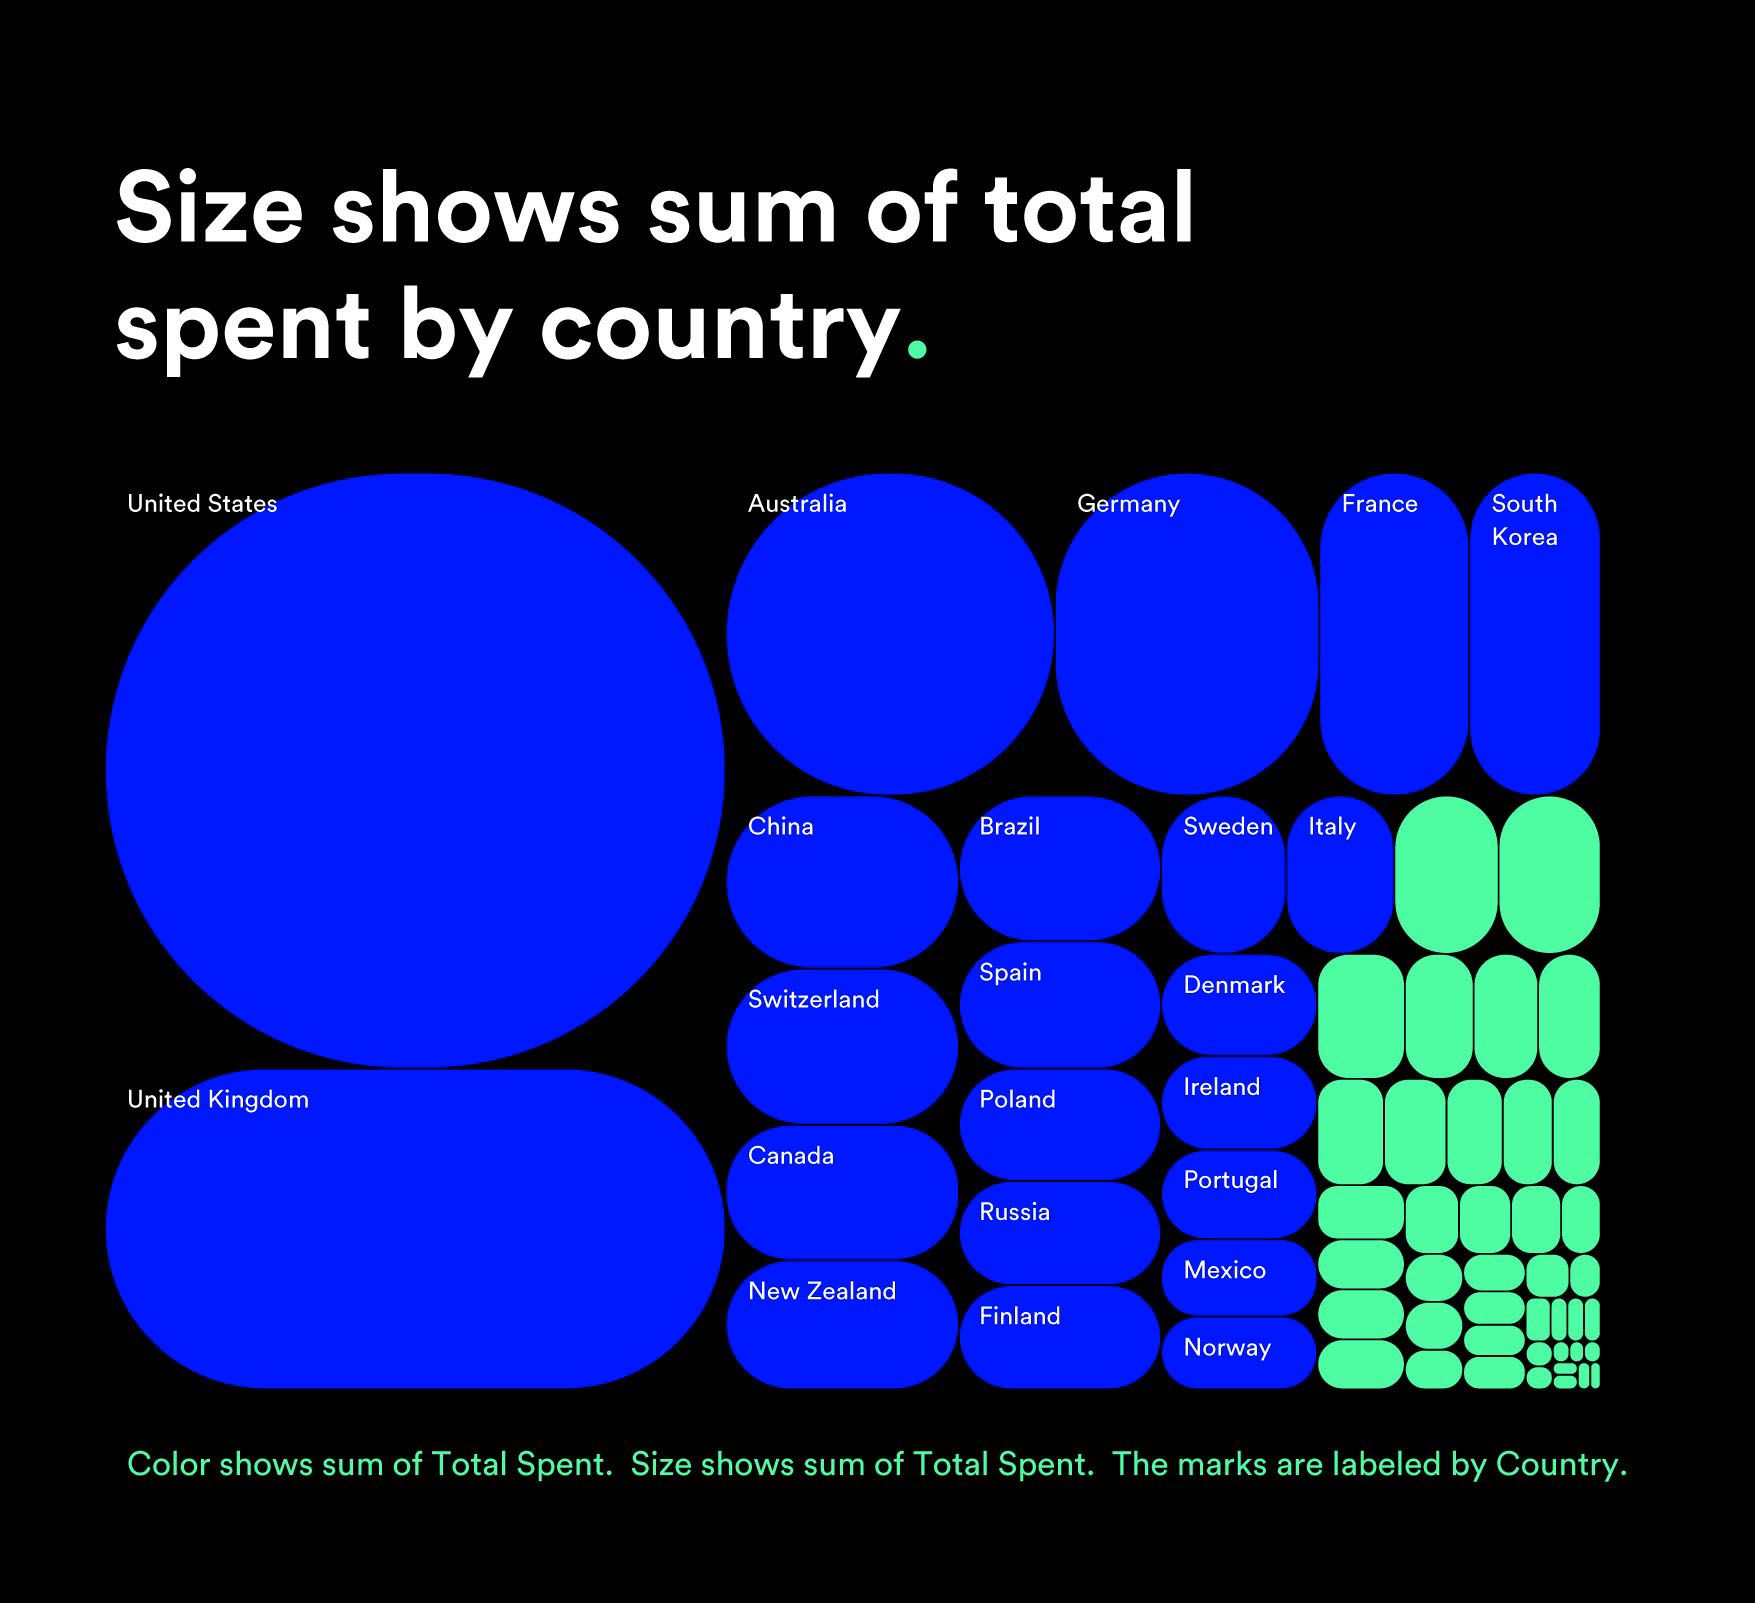
This is a data visualization using proportional circle sizes to represent monetary amounts spent by different countries. The design is clean, modern, and relies heavily on color variation to convey magnitude, creating a clear comparative chart.
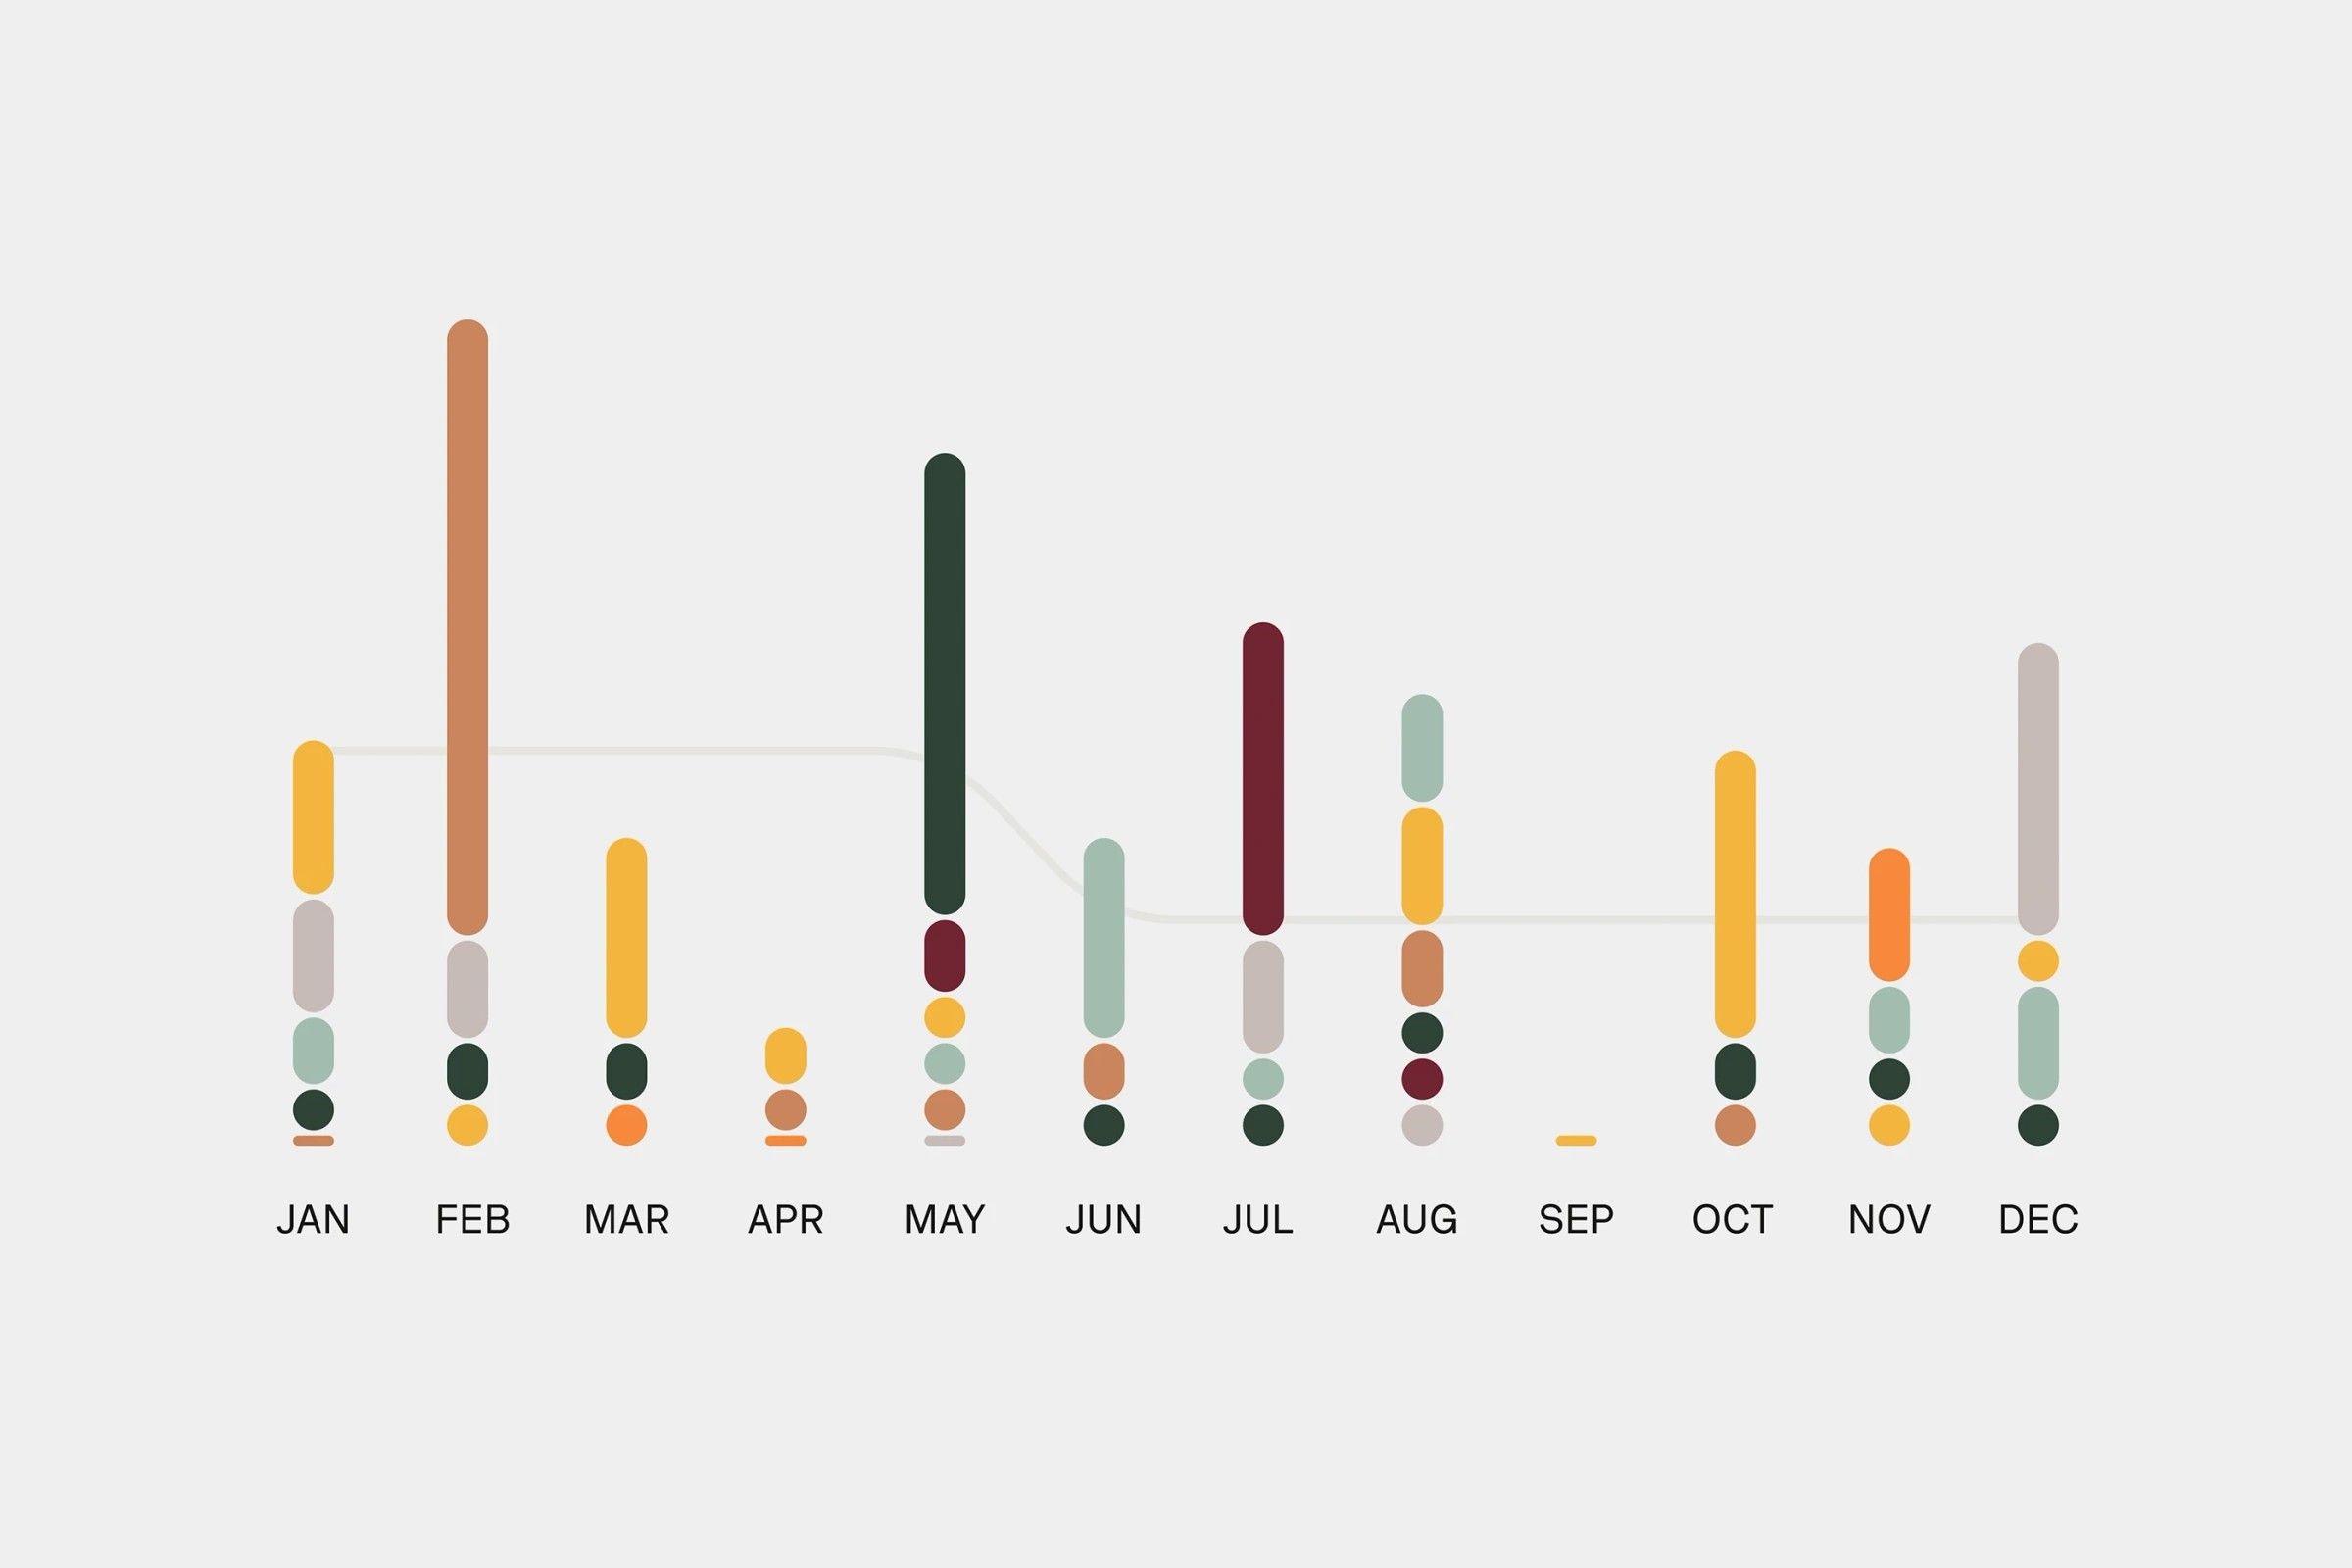
This is a minimalist, data-driven visualization using vertical bar charts to display monthly data points. The design relies heavily on color variation within a muted, neutral background to convey quantitative information clearly and cleanly.
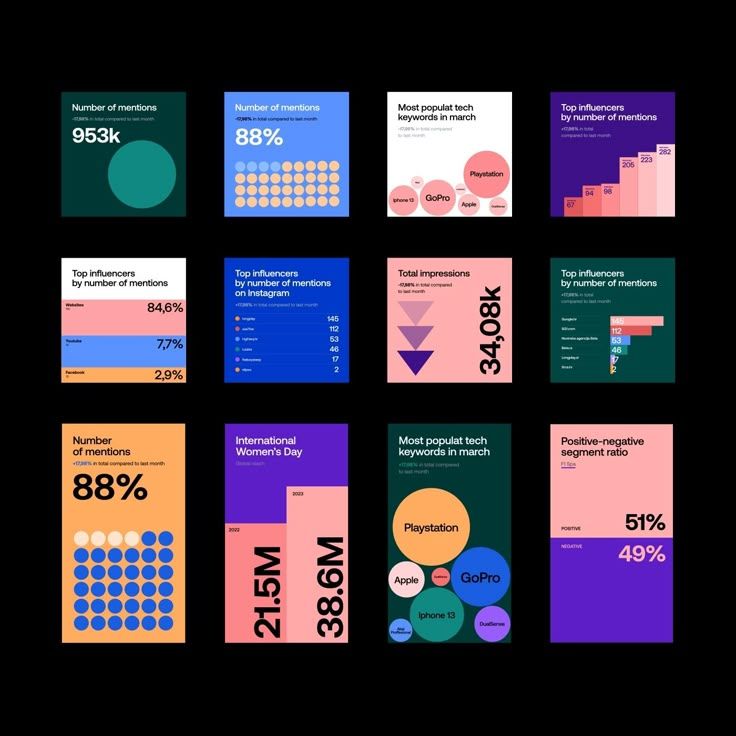
The image presents a grid of data visualizations, likely representing search engine or social media metrics, characterized by a clean, modern, and somewhat corporate aesthetic. It uses distinct color blocks and simple charts to convey quantitative information clearly.
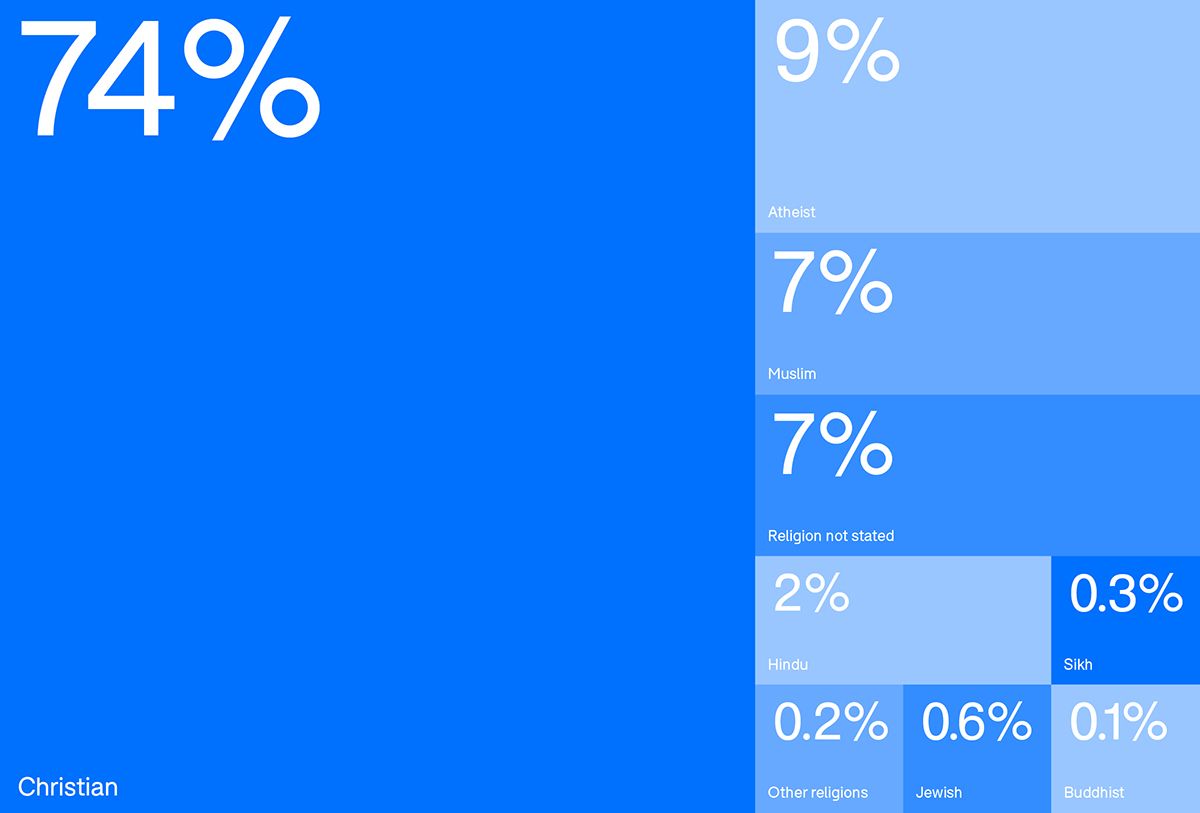
The image presents a stark, data-driven visualization using large blocks of solid blue color to represent percentages. The design is minimalist and functional, prioritizing the clear display of statistical information over elaborate aesthetics.
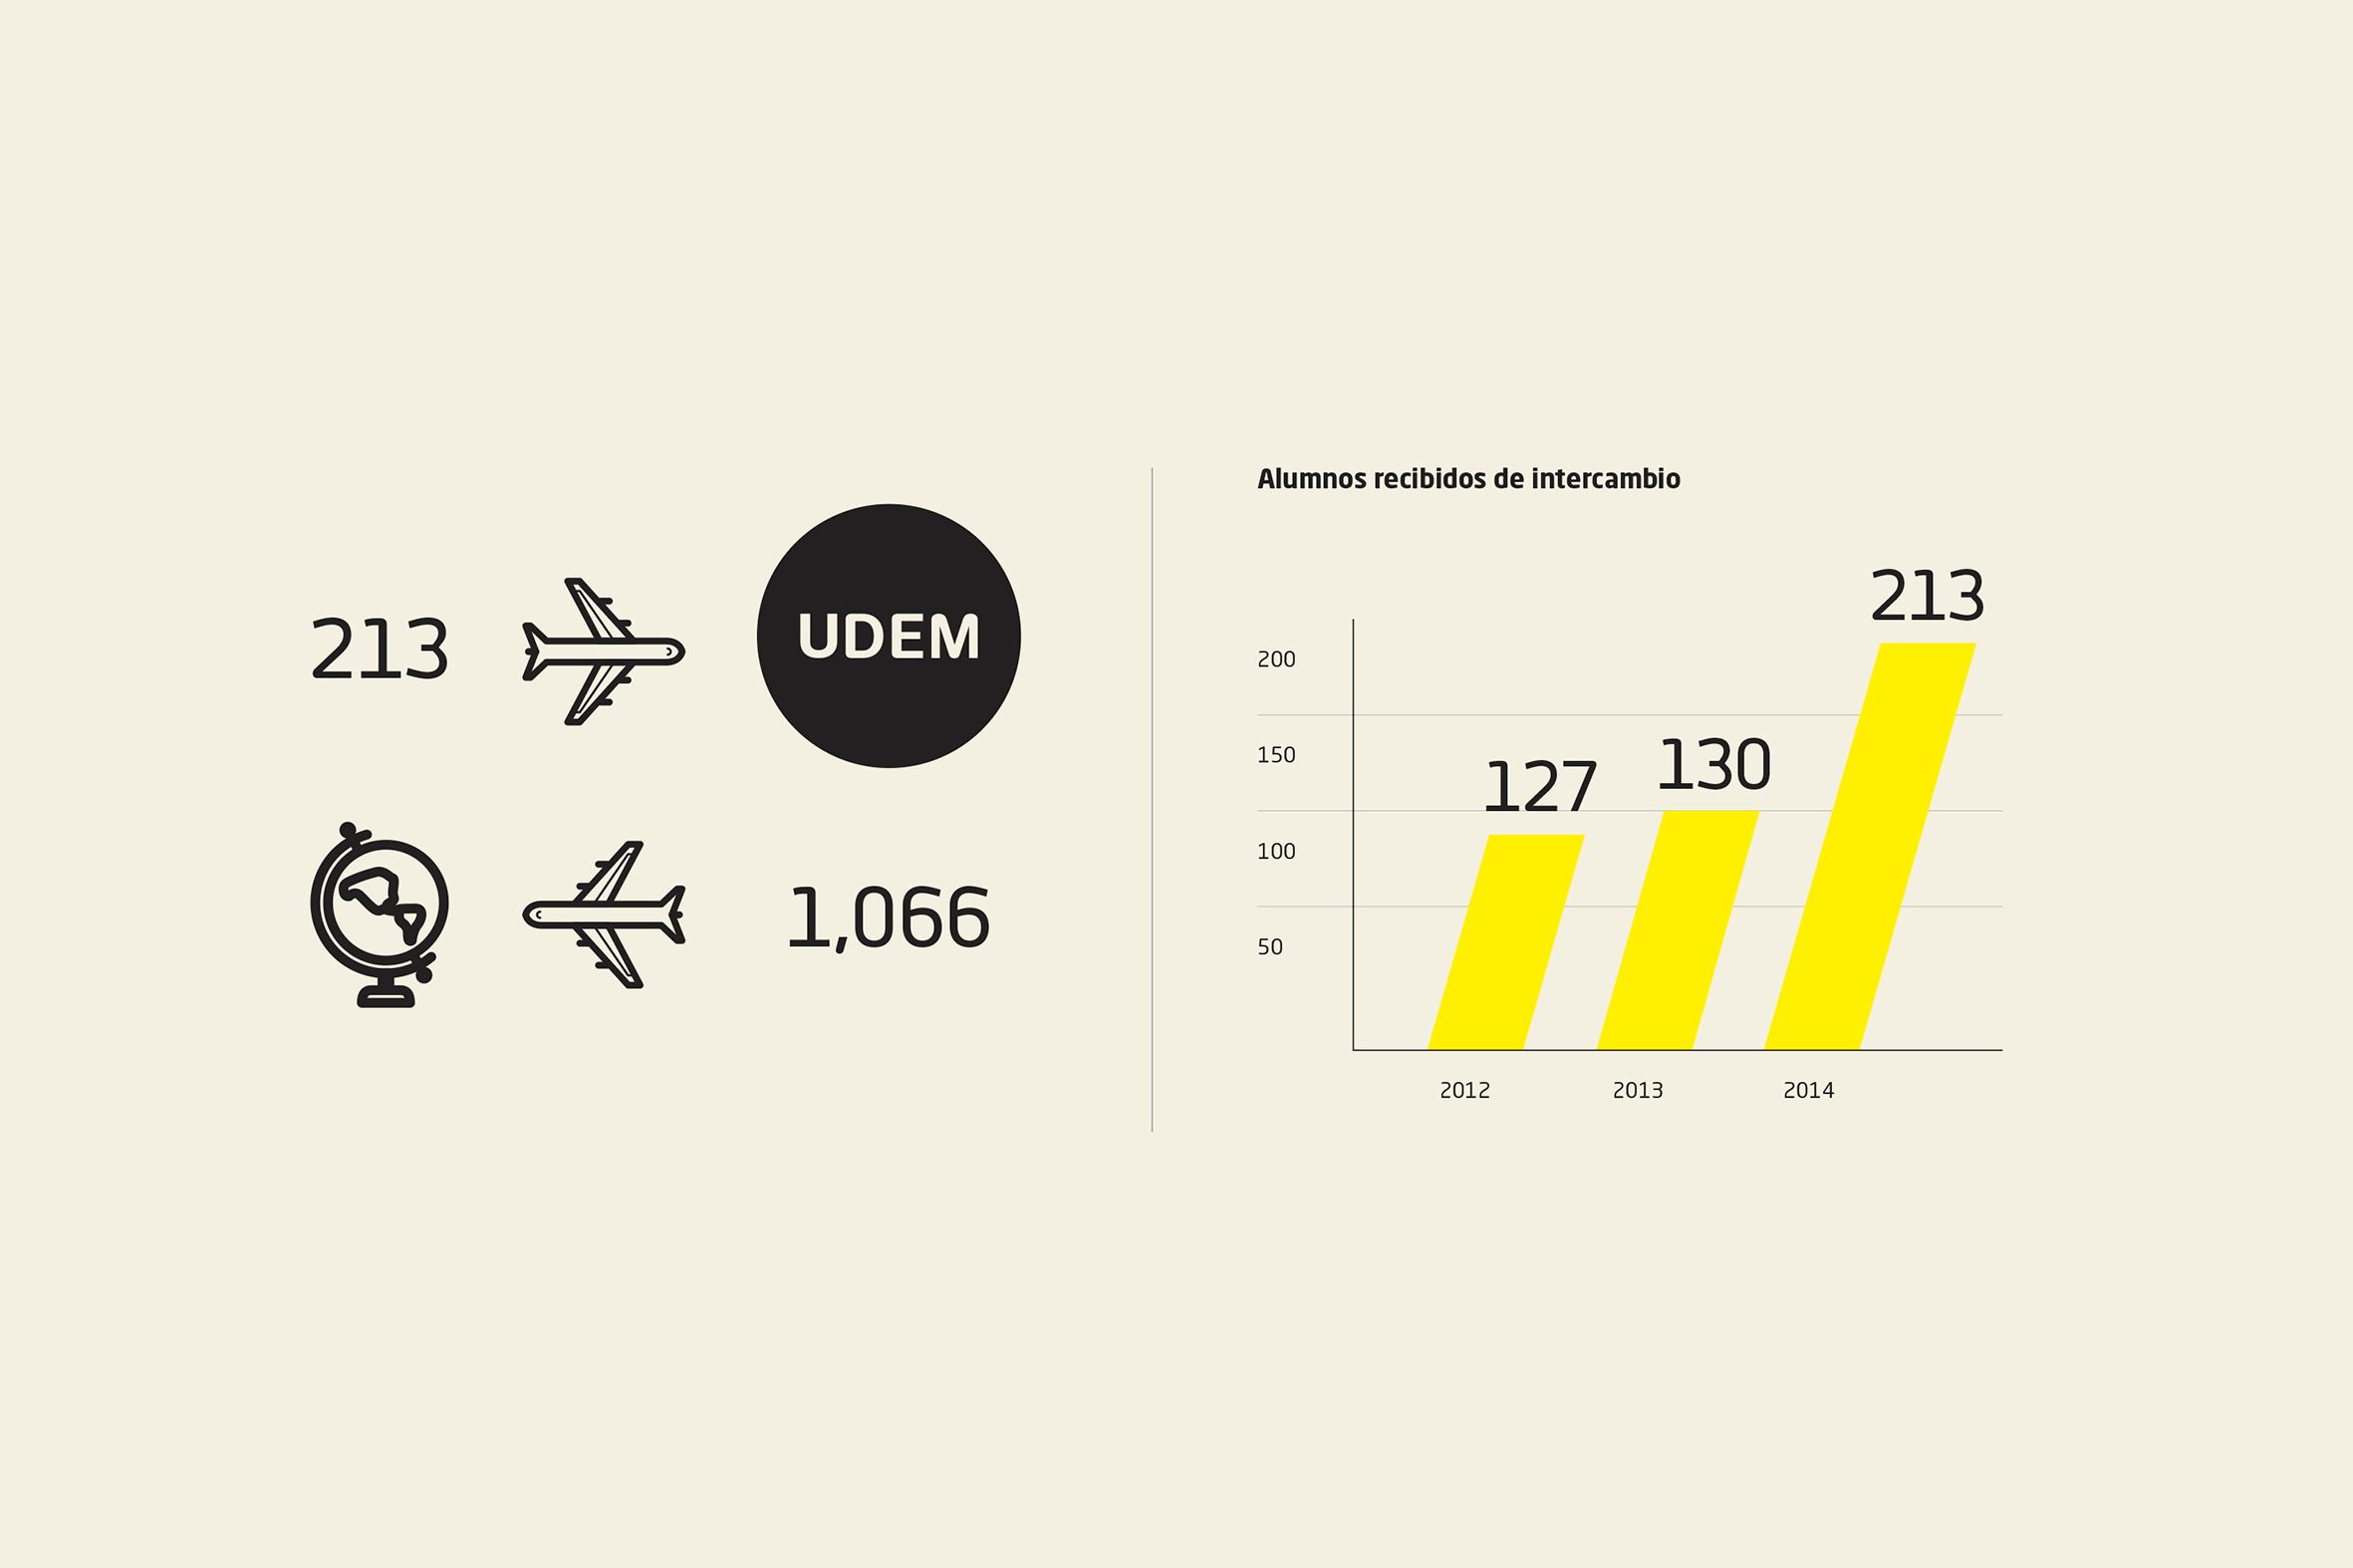
The image presents a minimalist, data-focused visualization using simple line graphs and icons against a neutral background. The design is clean, functional, and relies heavily on stark contrast between black, yellow, and beige tones to convey quantitative information clearly.
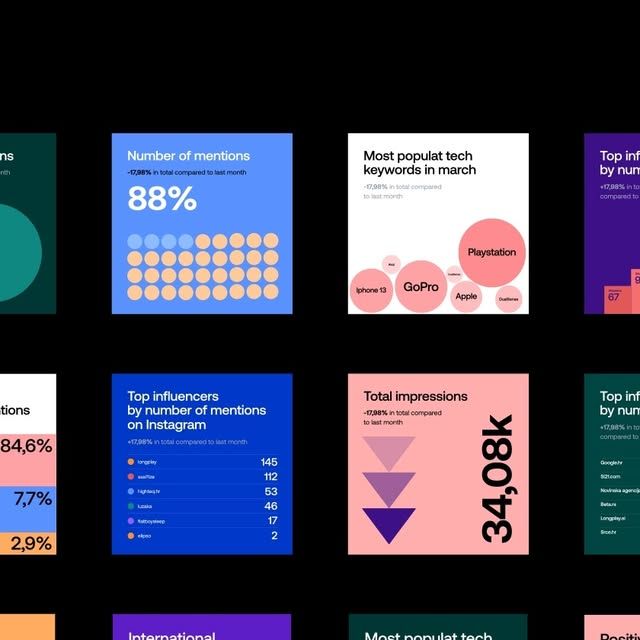
The image presents a dashboard or infographic style layout using a clean, modern aesthetic dominated by shades of blue and orange/pink. It utilizes circular and bar-like visualizations to present quantitative data in a structured, easily digestible format.
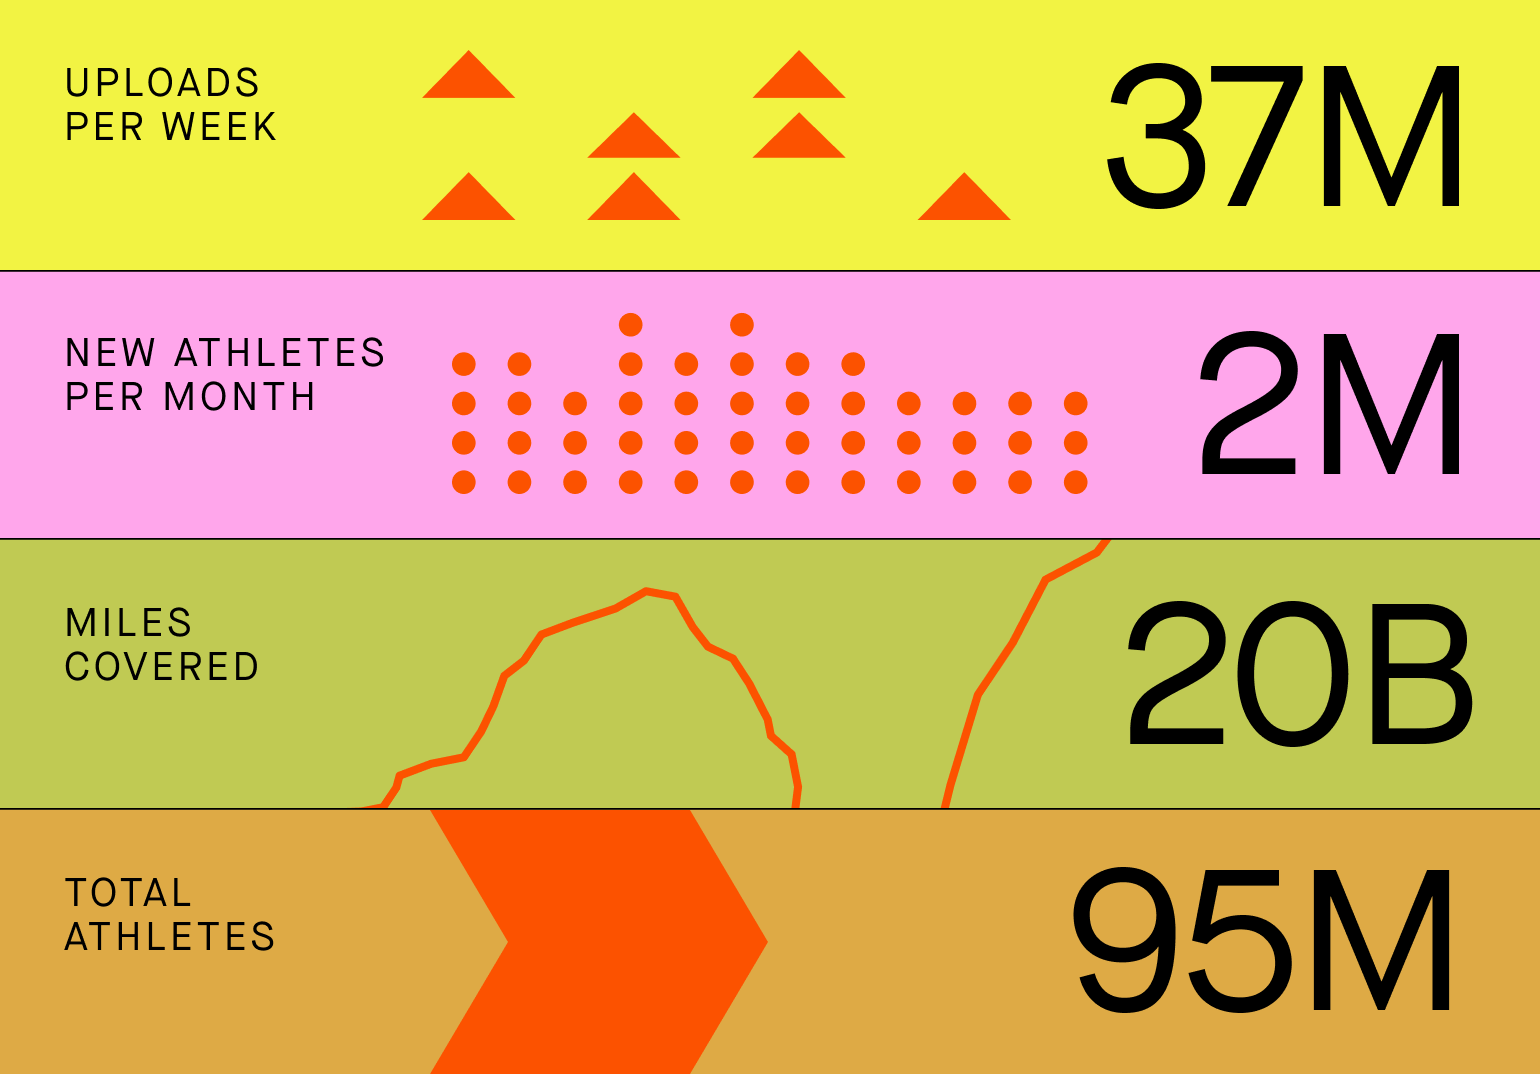
this is a clean and modern data visualization infographic that effectively stacks four key metrics using bright, distinct colors. the design prioritizes readability and immediate impact, making complex quantitative data easy to digest quickly.