1 designs
Showing 1 of 1 (1 total)
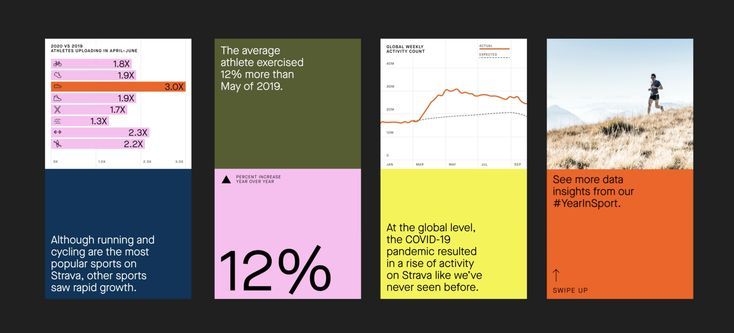
The design utilizes a clean, modular grid layout to present multiple data visualizations in an infographic style. It employs strong color blocking and contrasting accents (orange, green, blue) to clearly differentiate metrics and highlight key findings. The visual language is professional, analytical, and highly focused on conveying statistical information.