heatmap
3 designs
Showing 3 of 3 (3 total)
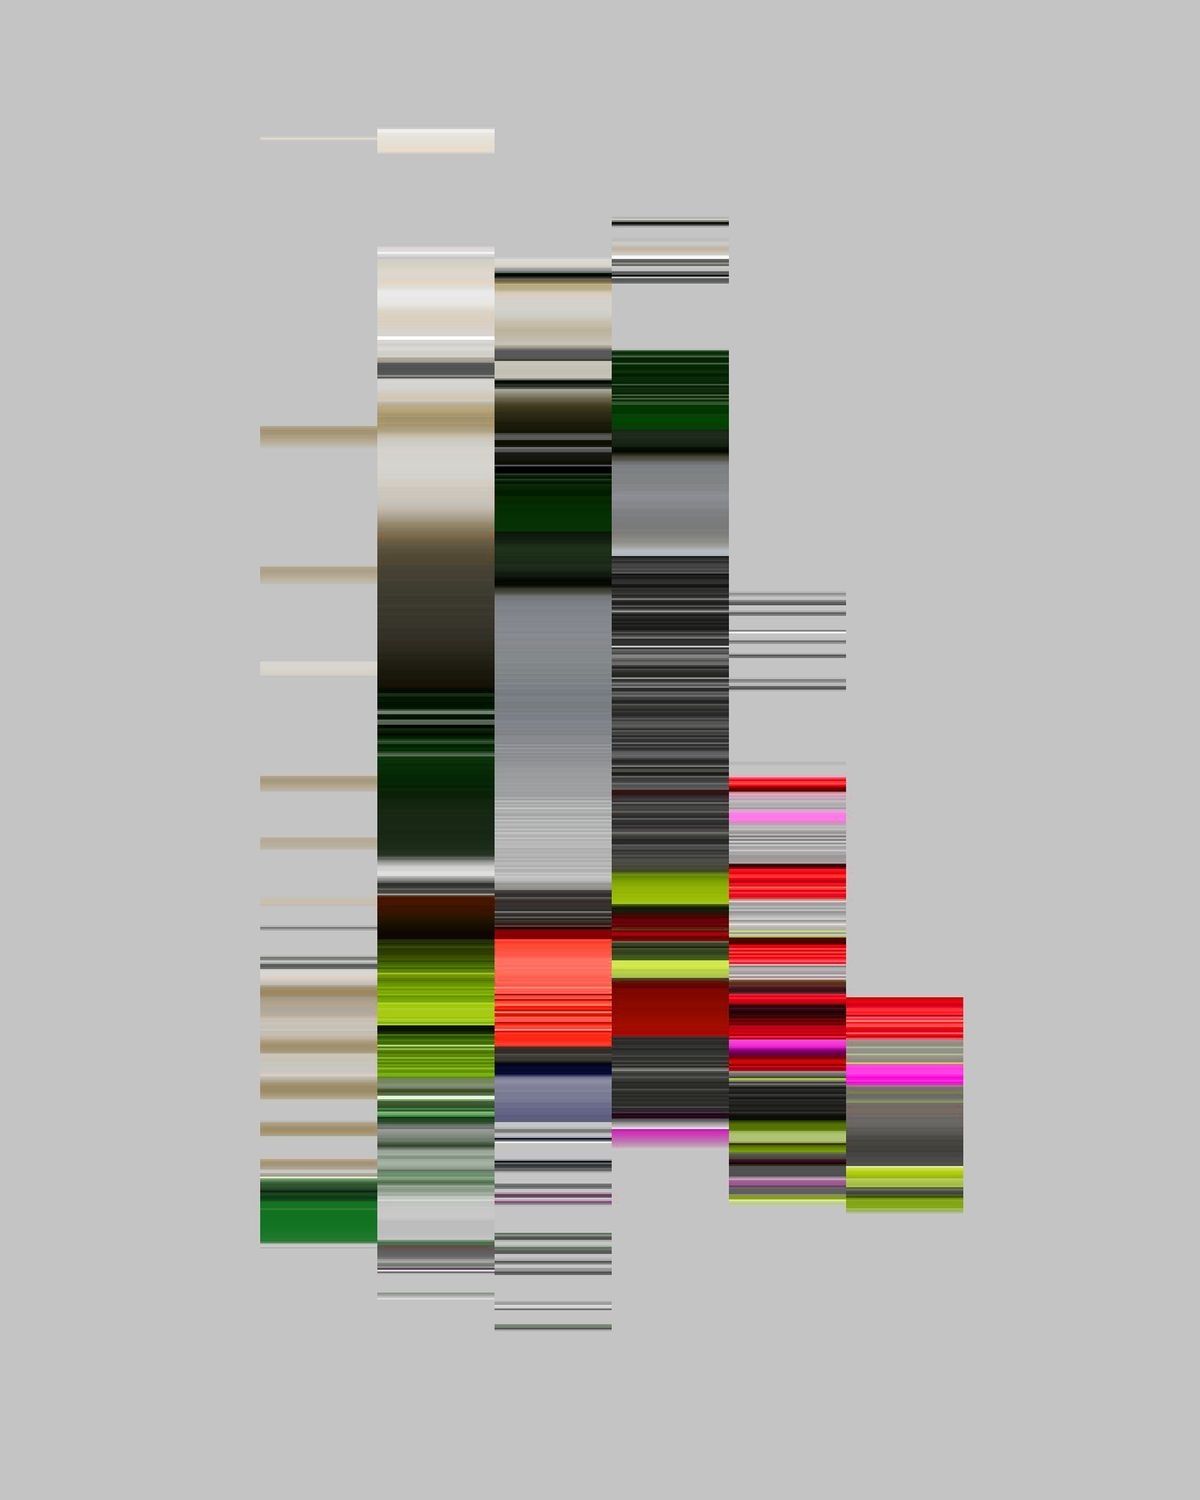
This image is a dense, abstract visualization resembling a heatmap or gene expression profile, characterized by numerous horizontal bars of varying shades and lengths. The visual language is highly data-driven and technical, relying on texture and color variation to convey information.
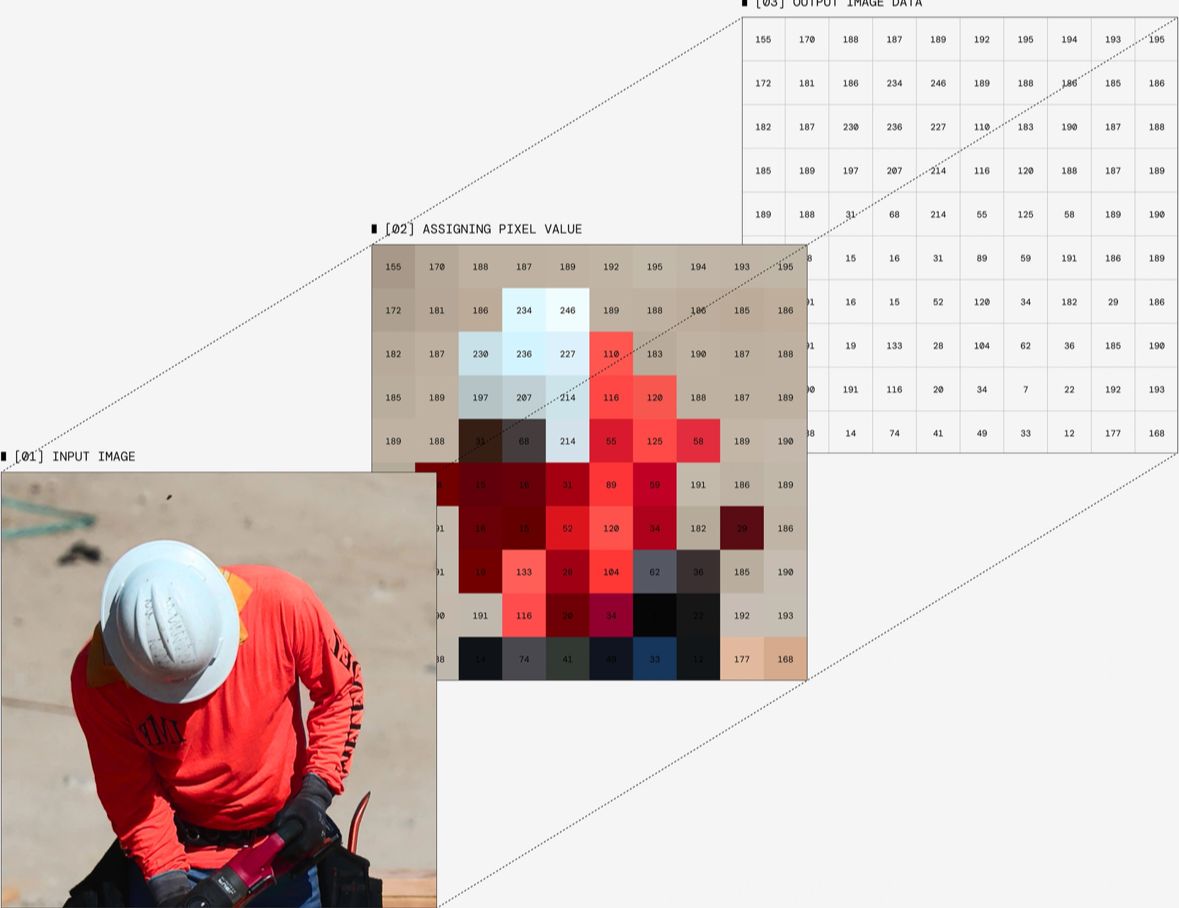
This image presents a technical visualization, likely related to image processing or pixel assignment, characterized by a grid structure and a heatmap-like matrix. The design is highly functional and data-driven, relying on color intensity to convey numerical values across different pixel combinations.
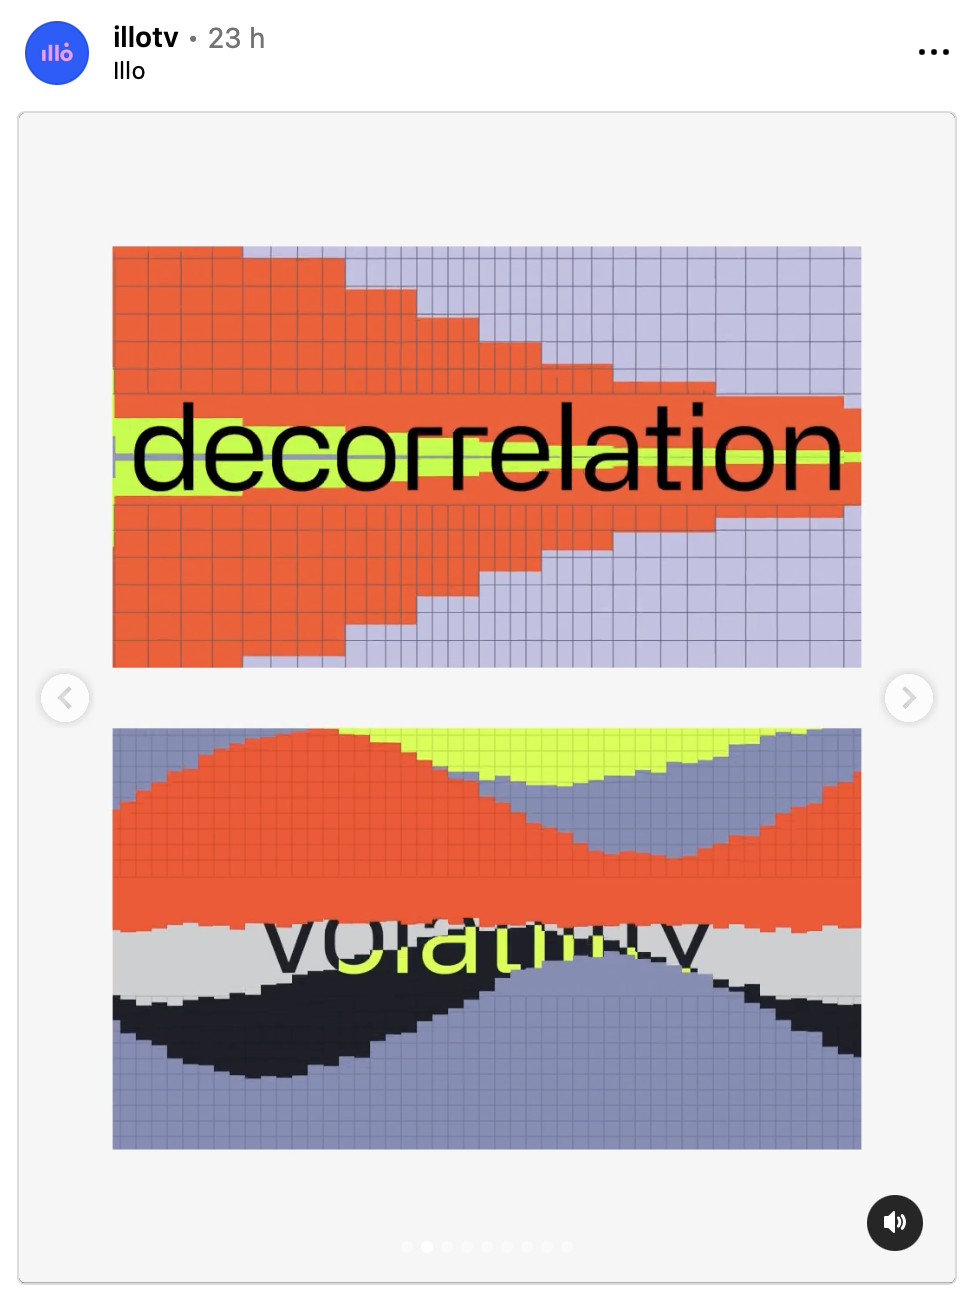
This image features two stacked data visualizations using grid structures and color gradients to represent abstract concepts like decorrelation and volatility. The design utilizes a clean, modern aesthetic focused on conveying complex data relationships through visual metaphors.