quantitative
6 designs
Showing 6 of 6 (6 total)
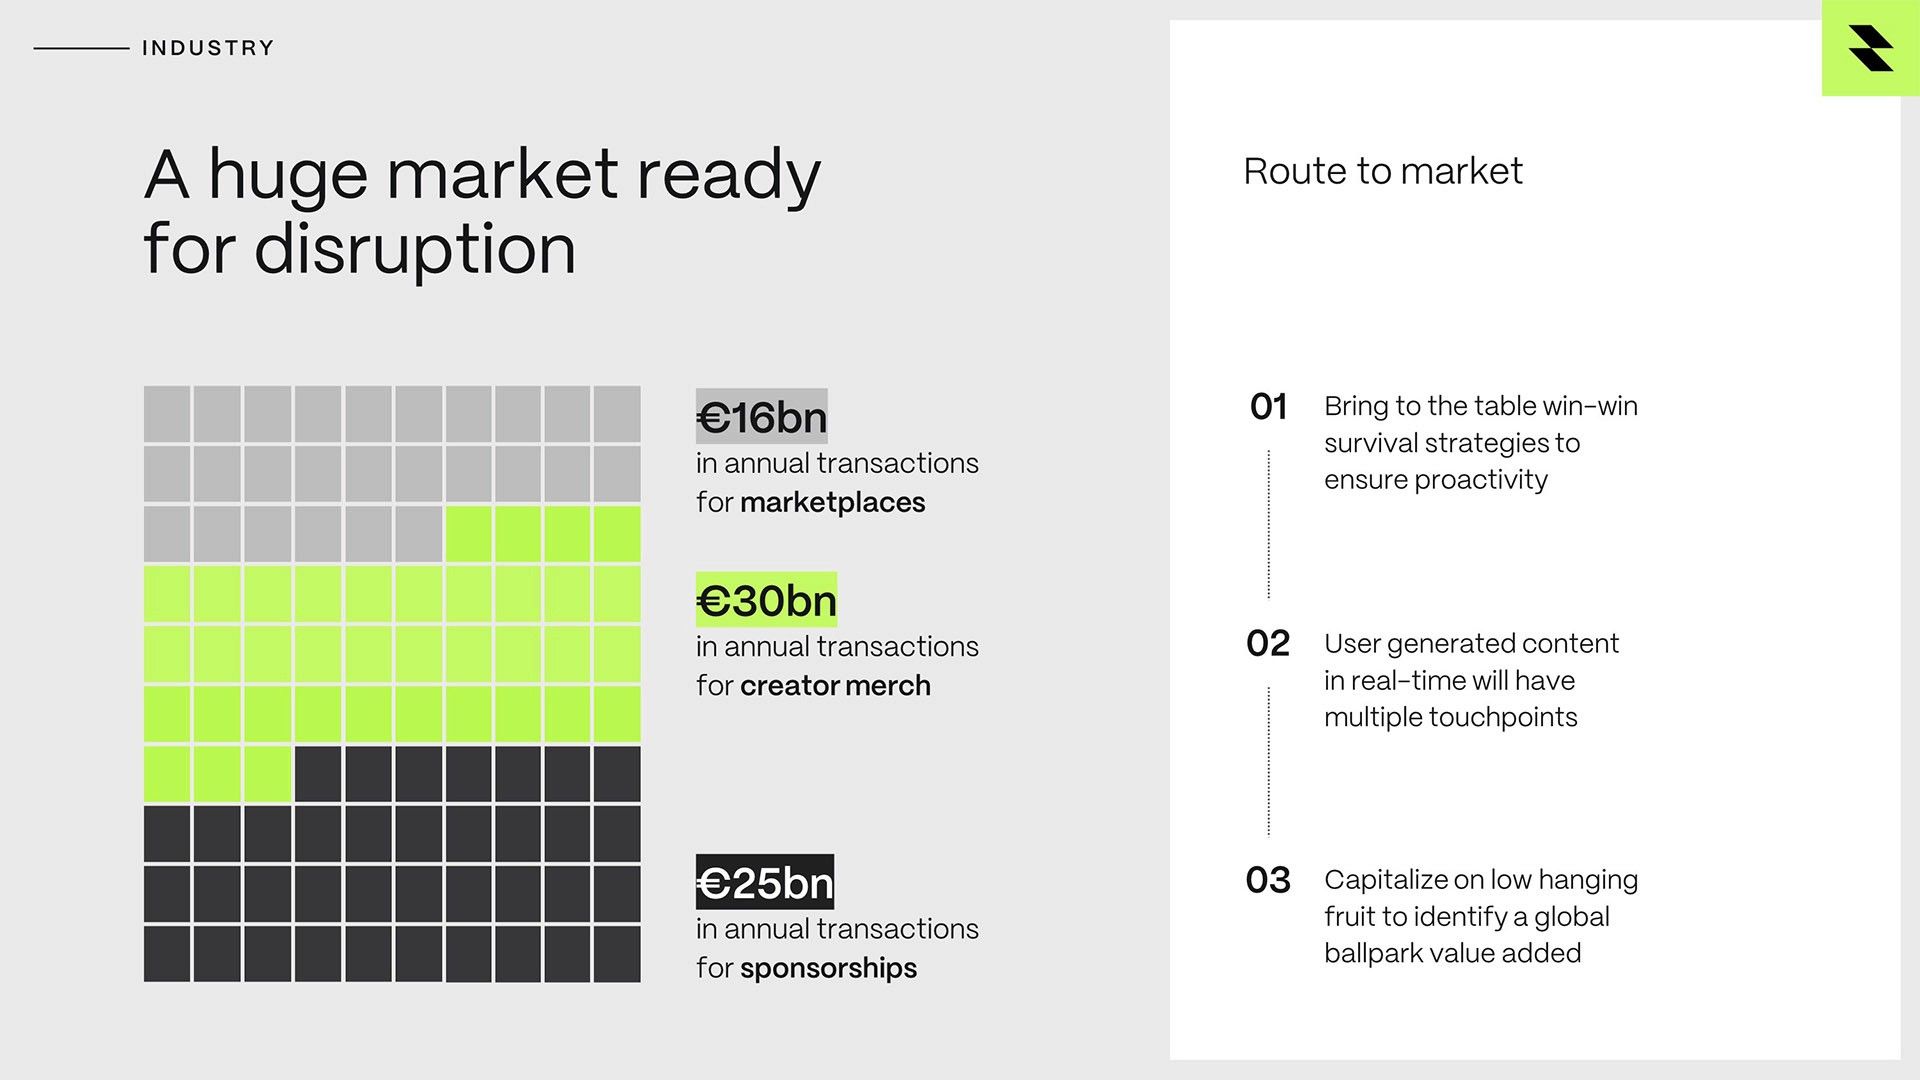
The image presents a data-driven, infographic-style visualization using a grid to represent market size segments. The design is clean and uses color blocking effectively to differentiate between different revenue streams, conveying a sense of quantitative analysis.
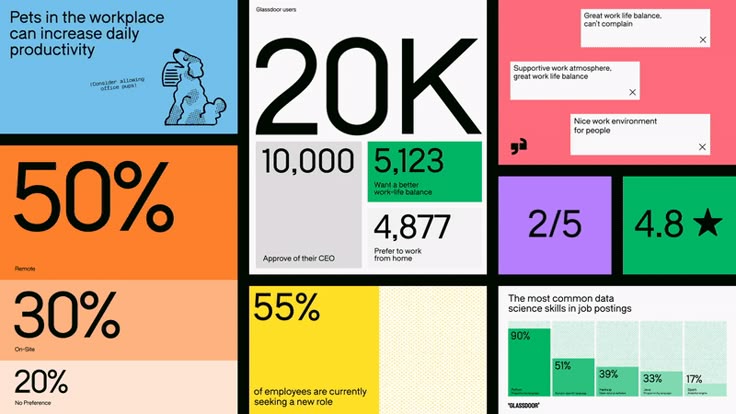
The image is a data visualization or infographic presenting various statistics in a segmented, block-based layout. It uses strong color blocking and large numbers to convey quantitative information quickly.
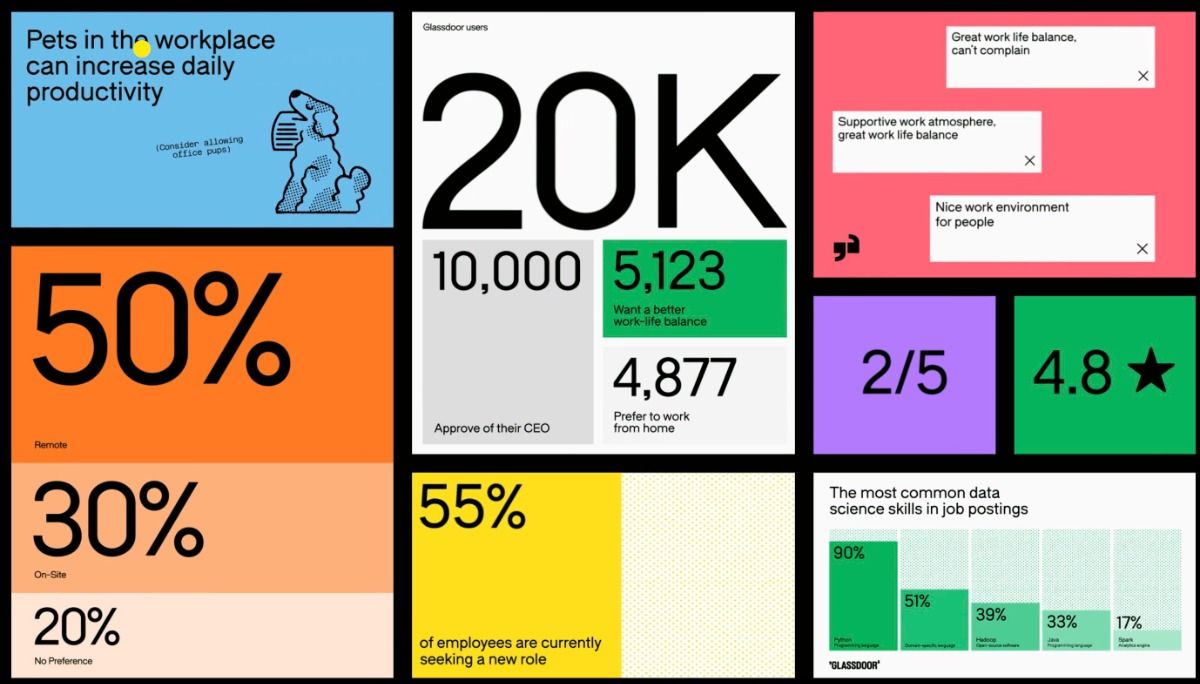
The image is a data visualization or infographic presenting statistics related to employee productivity and satisfaction, using a clean, block-based layout. It employs high contrast between white/light backgrounds and bold, dark text to present quantitative information clearly.
The image presents a data visualization or testimonial summary using a clean, modern, and segmented block layout. It employs distinct colors for different metrics to create clear visual hierarchy and separates quantitative data points effectively.
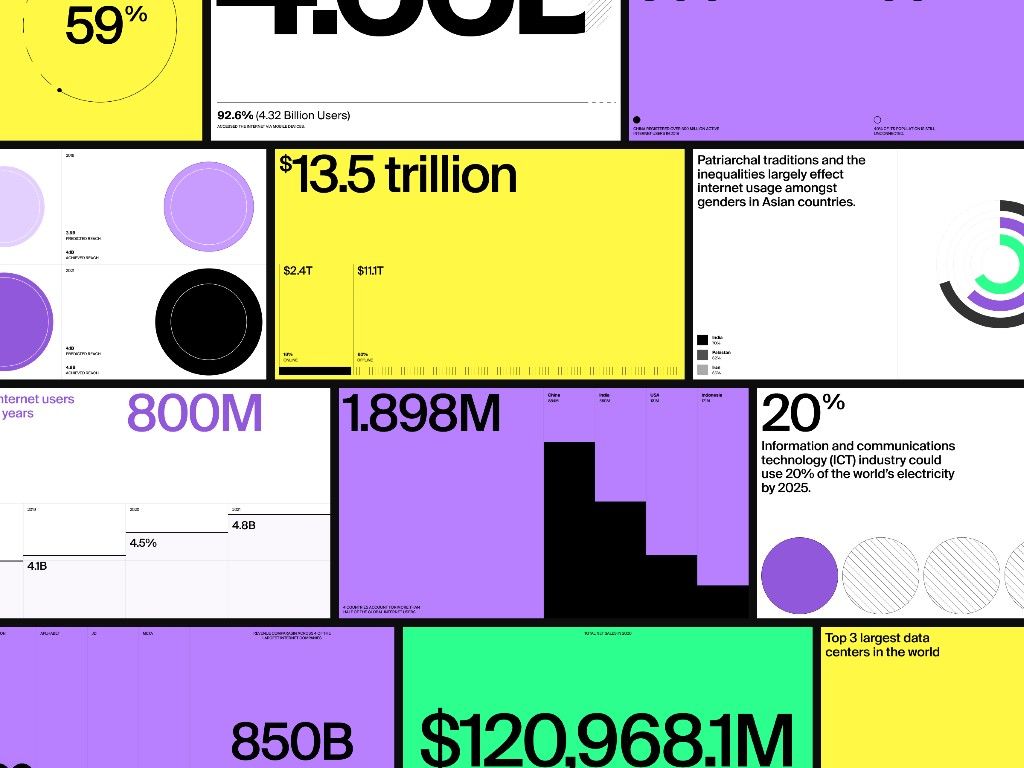
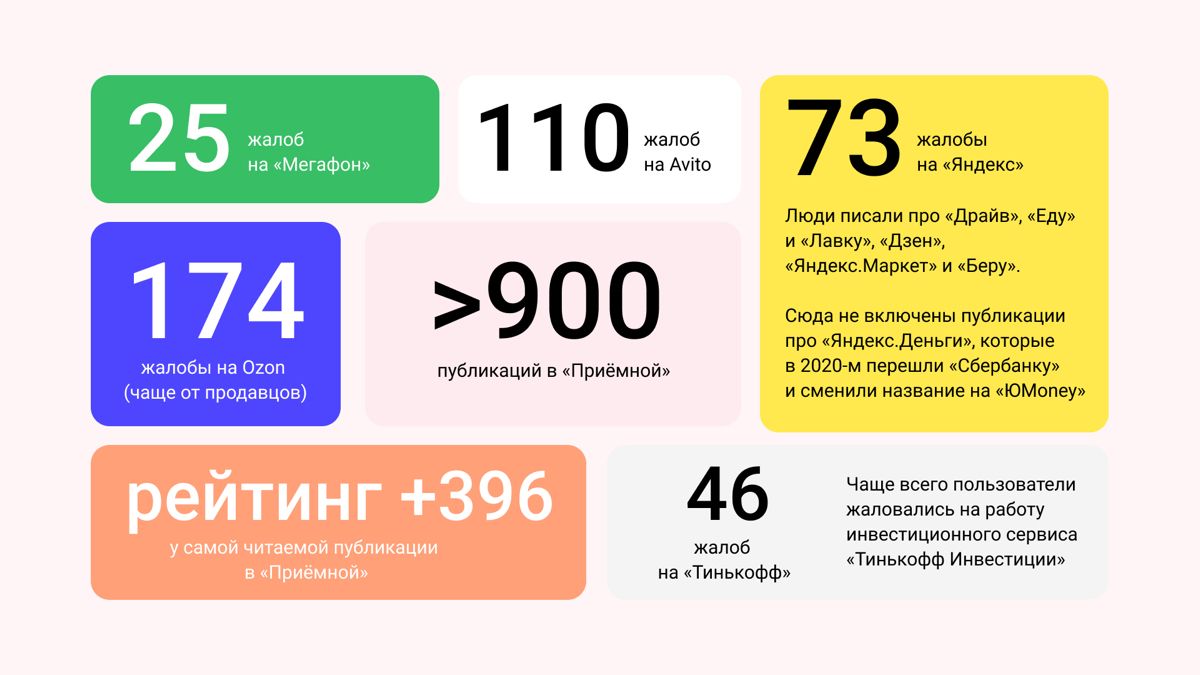
The image is a data visualization collage characterized by bright, saturated colors and stark contrasts between large numbers and simple graphical elements. It employs a modular layout to present various statistics quickly, giving it a dense, infographic feel.
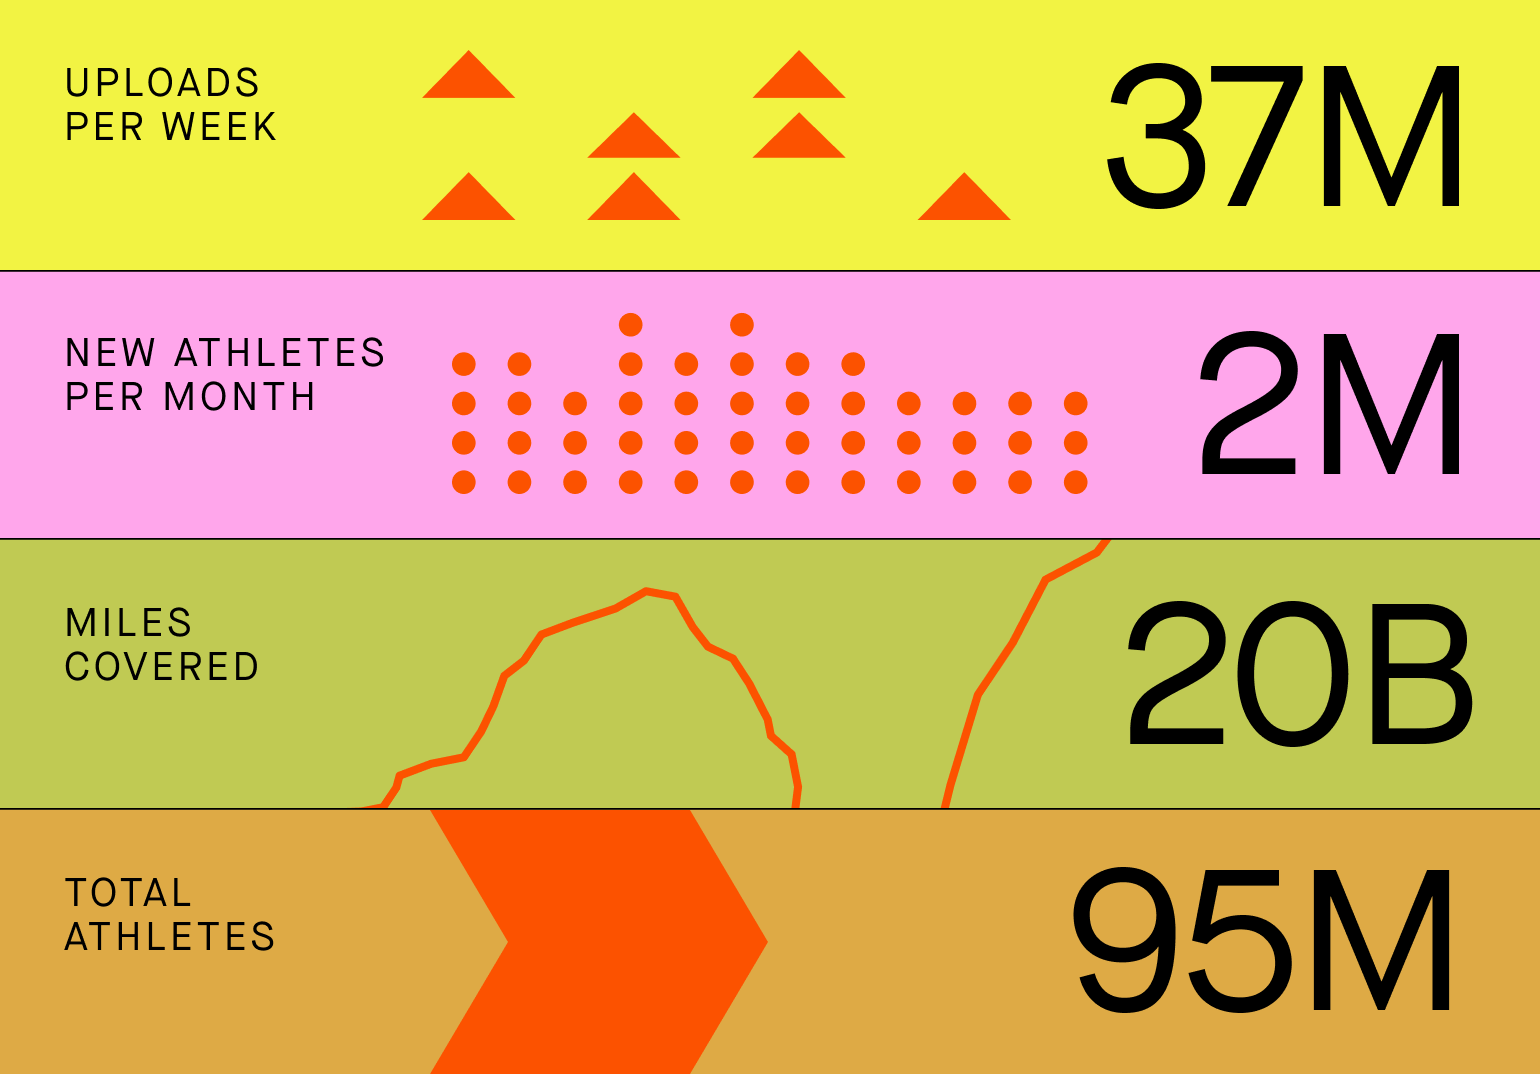
this is a clean and modern data visualization infographic that effectively stacks four key metrics using bright, distinct colors. the design prioritizes readability and immediate impact, making complex quantitative data easy to digest quickly.