objective
86 designs
Showing 24 of 86 (86 total)

The image presents a minimalist, low-fidelity scene characterized by simple geometric blocks and muted colors, strongly suggesting an early-stage or retro video game environment. The design prioritizes functional gameplay space over elaborate visual detail.
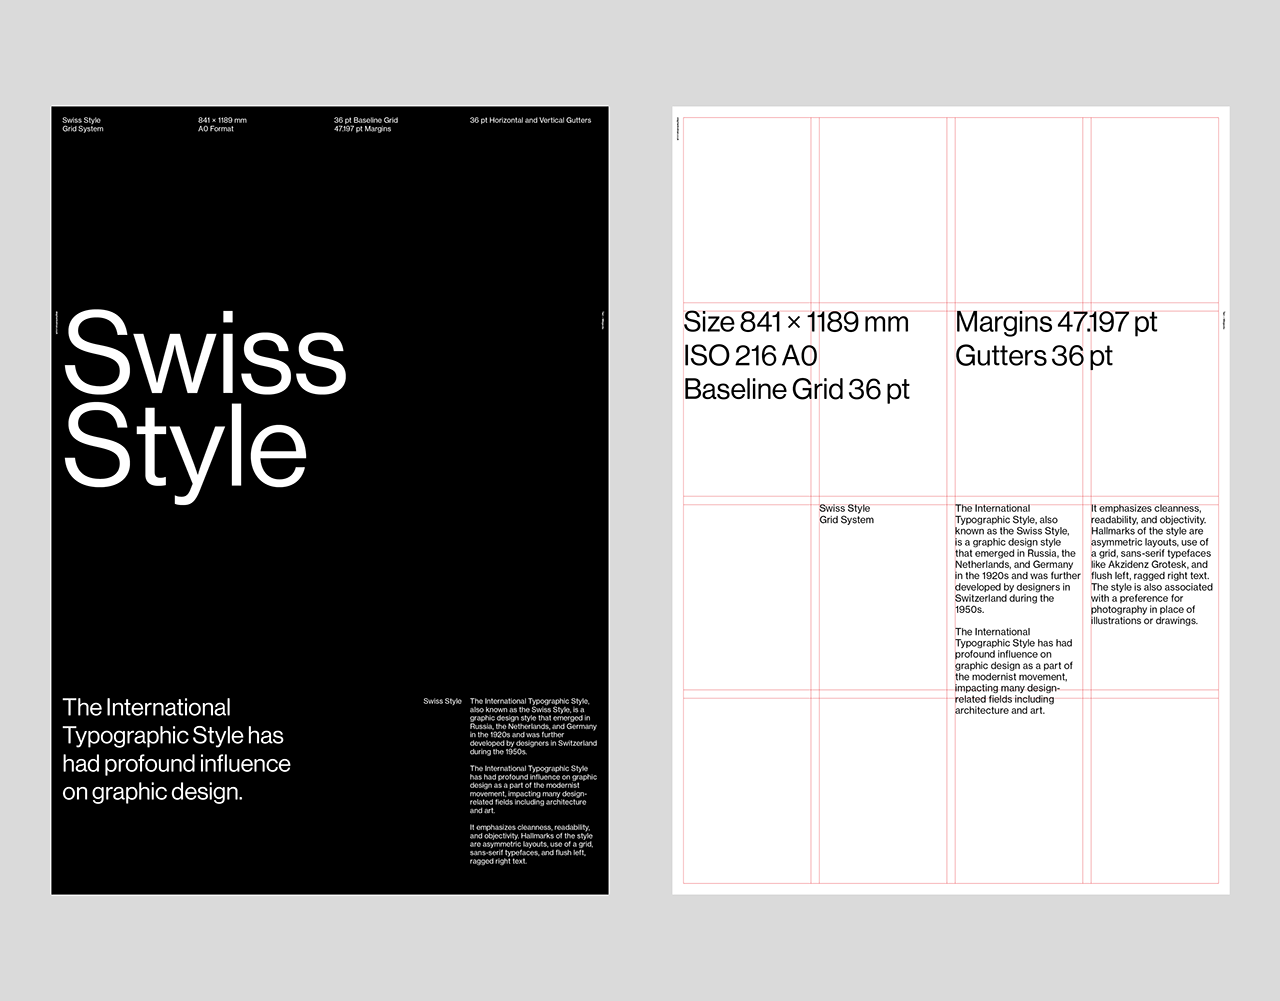
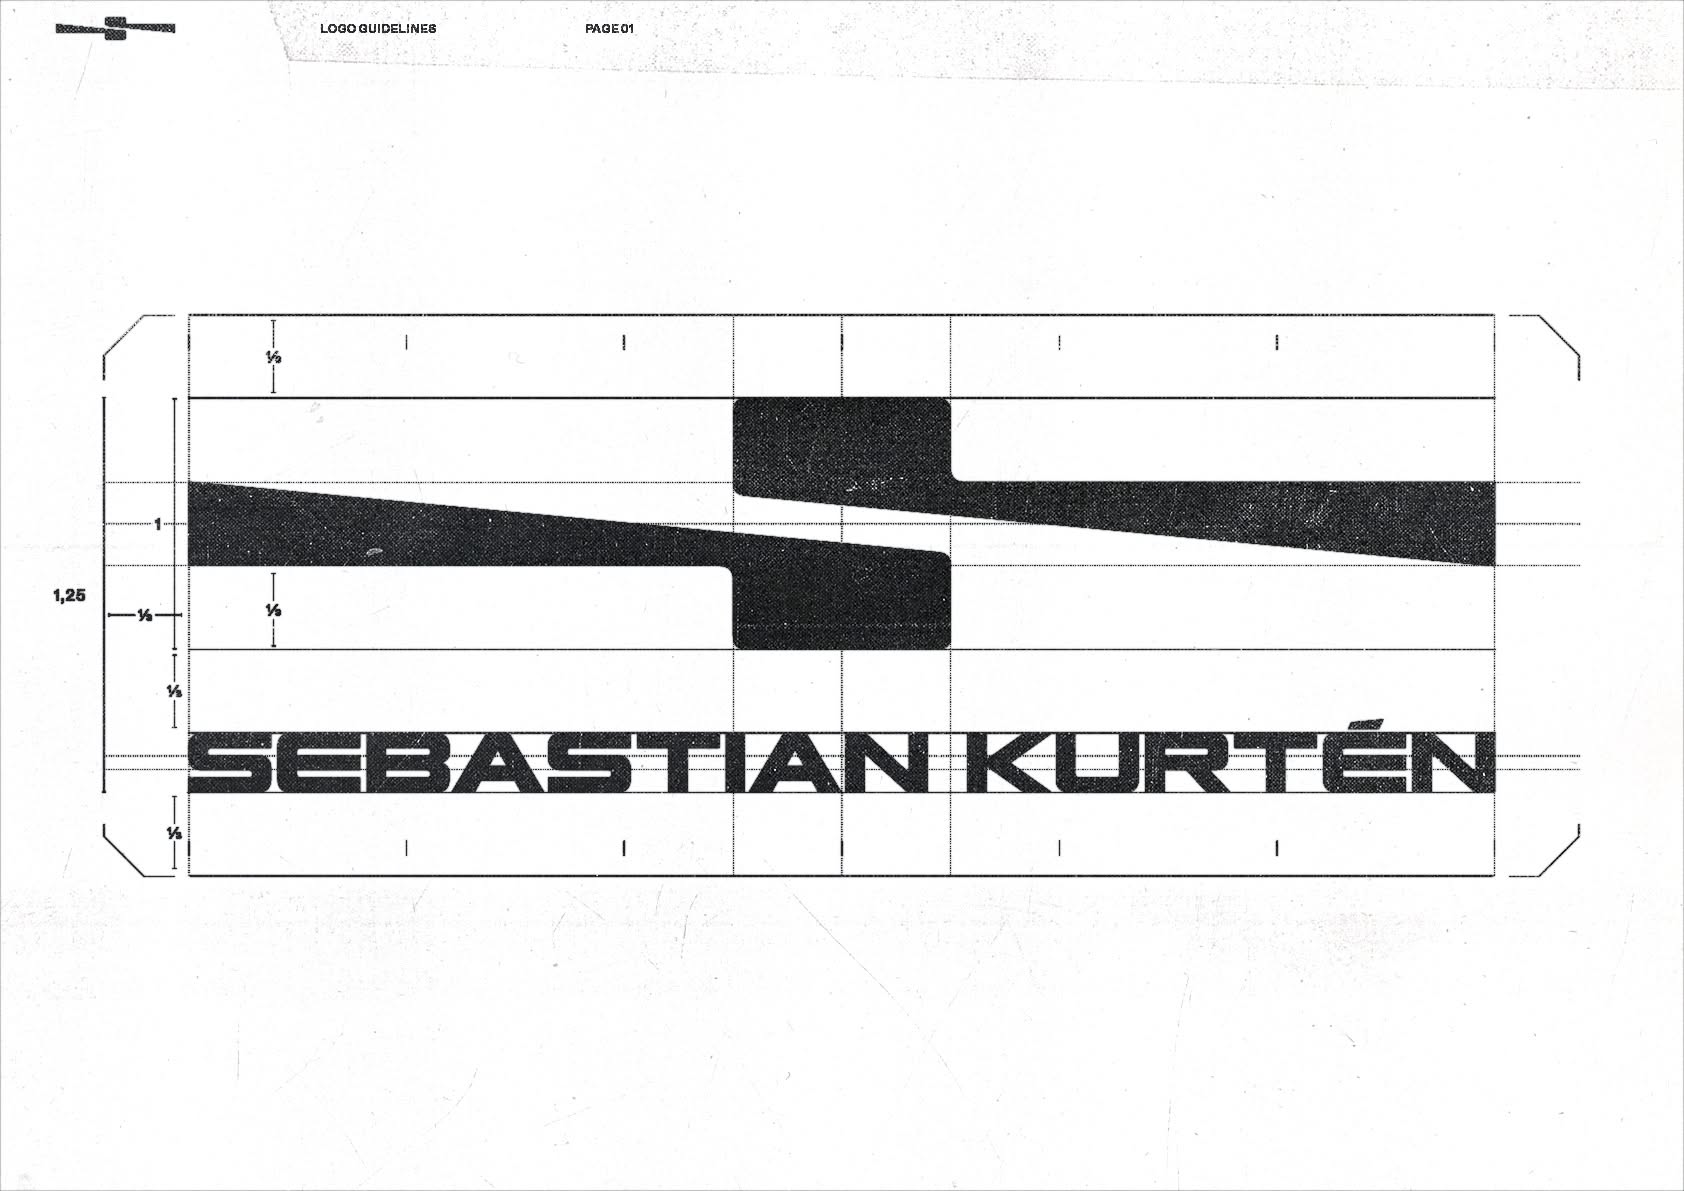
This visual presents a highly structured and minimalist approach, characteristic of Swiss design principles. The layout emphasizes precision through the use of strict grid systems and clear typographic hierarchy, conveying a sense of objective professionalism.
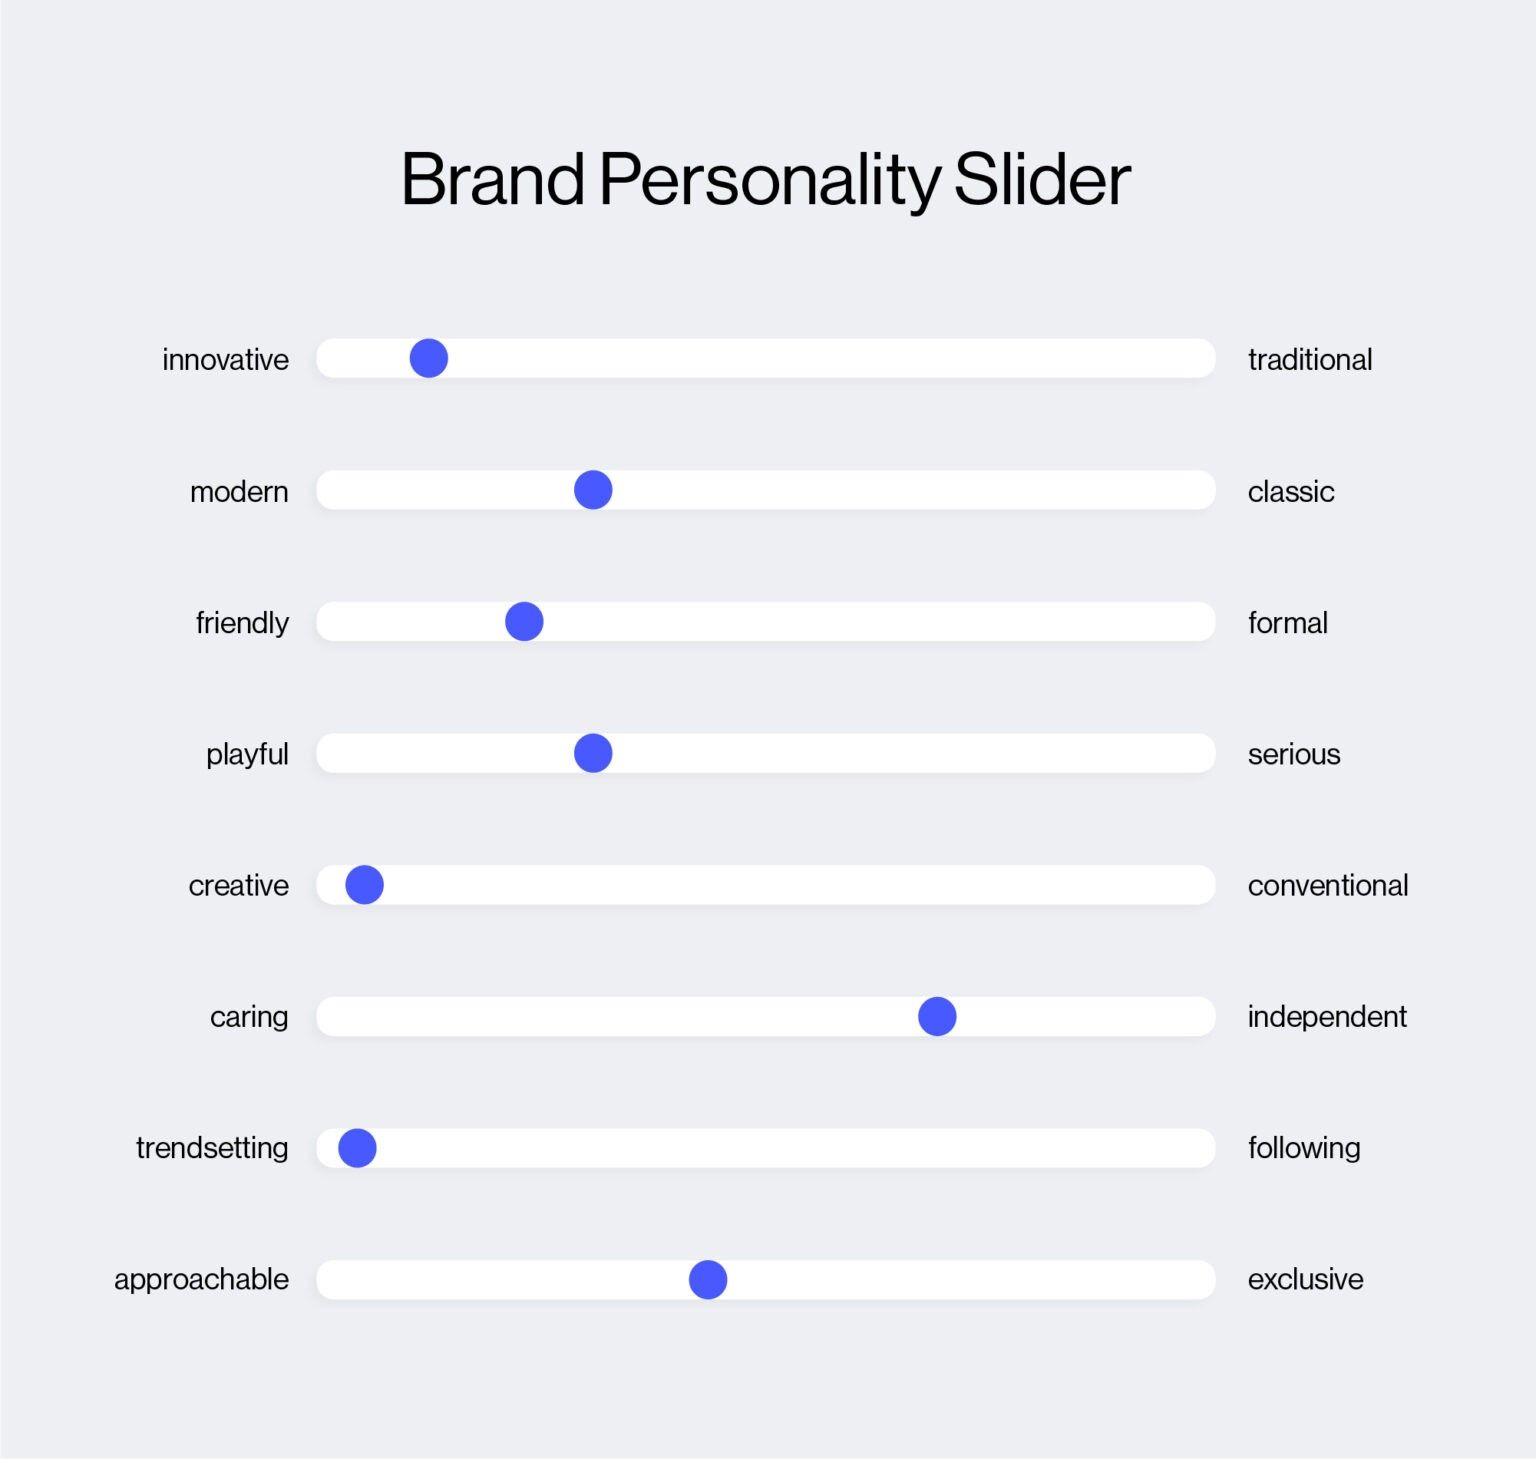
This is a clean, minimalist data visualization tool presenting brand personality traits through a linear slider format. The design uses simple horizontal lines and distinct blue markers to clearly map subjective attributes onto a spectrum, offering an objective way to assess brand positioning.
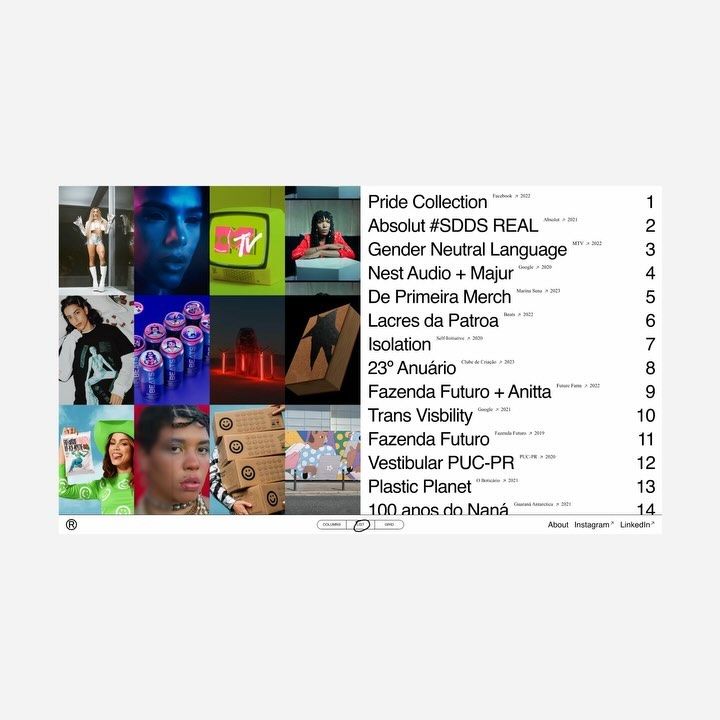
This design utilizes a clean, minimalist approach to present a ranked list or collection. The visual language is highly structured, relying on clear typography and numbered entries to convey information efficiently. The overall feel is objective and editorial, prioritizing readability over elaborate decoration.
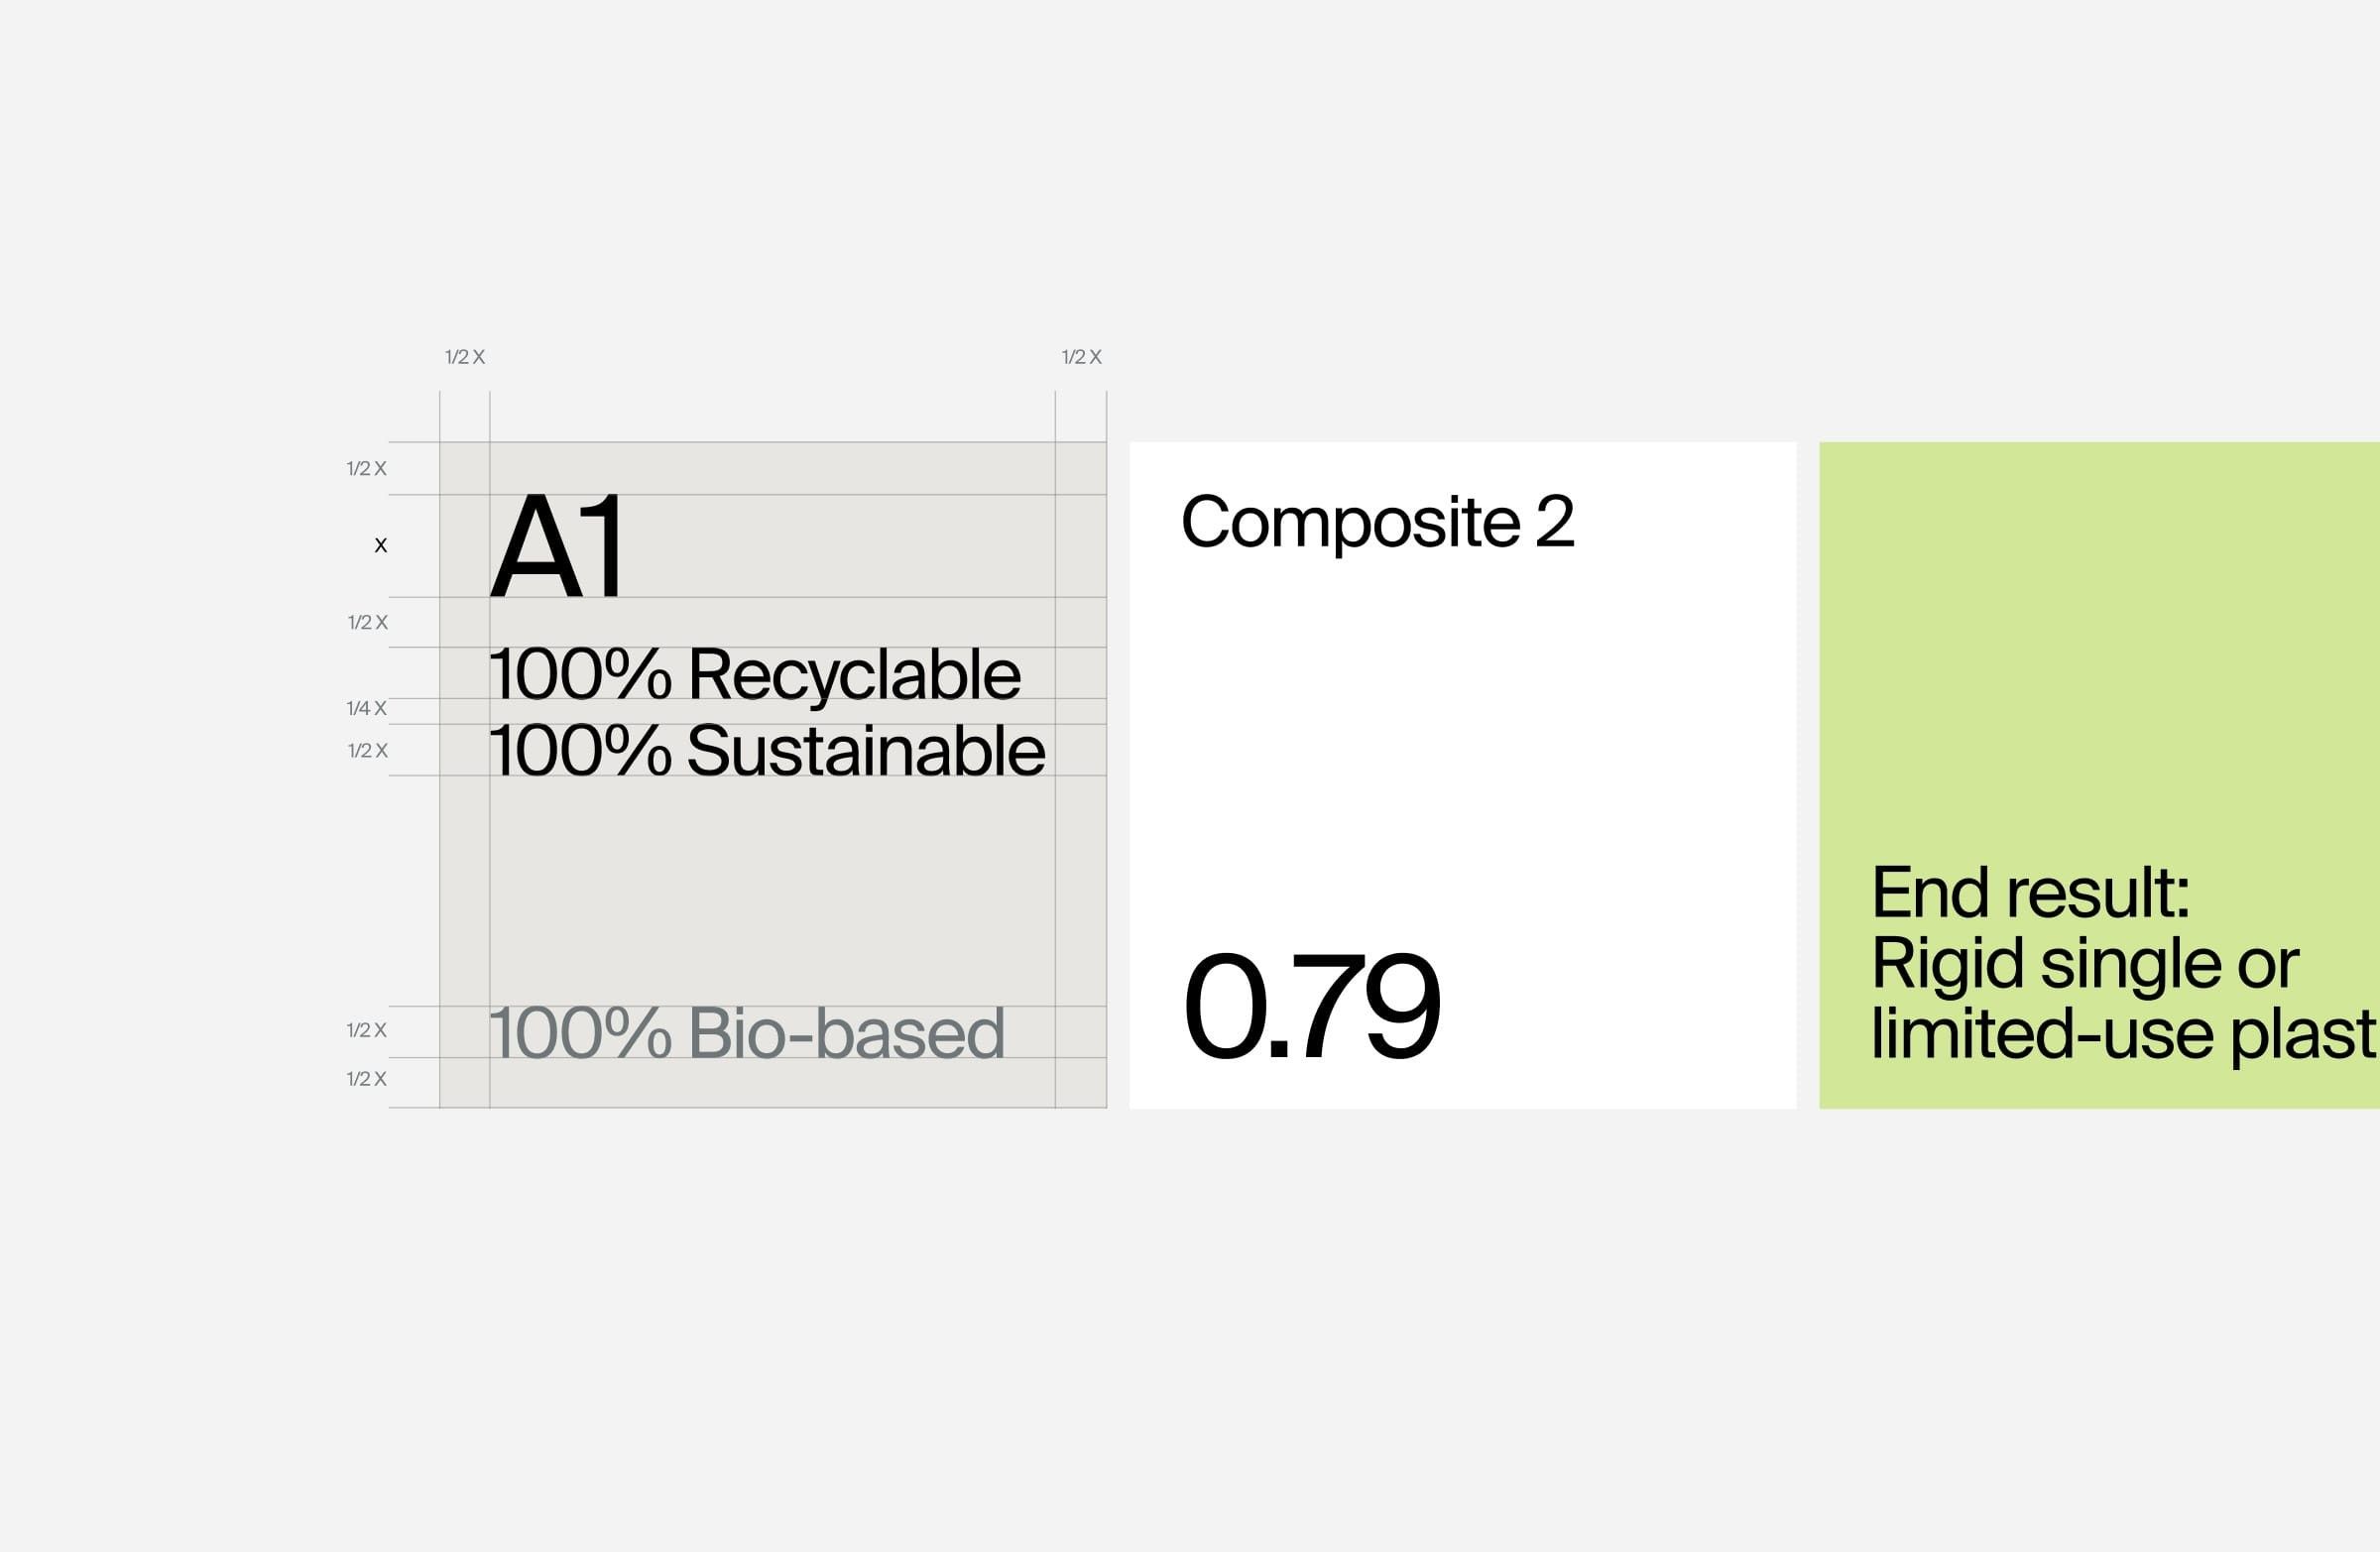
This is a highly functional data visualization presenting material composition and sustainability metrics in a clean, minimalist format. The design relies on clear typography and simple geometric shapes to convey technical information effectively.
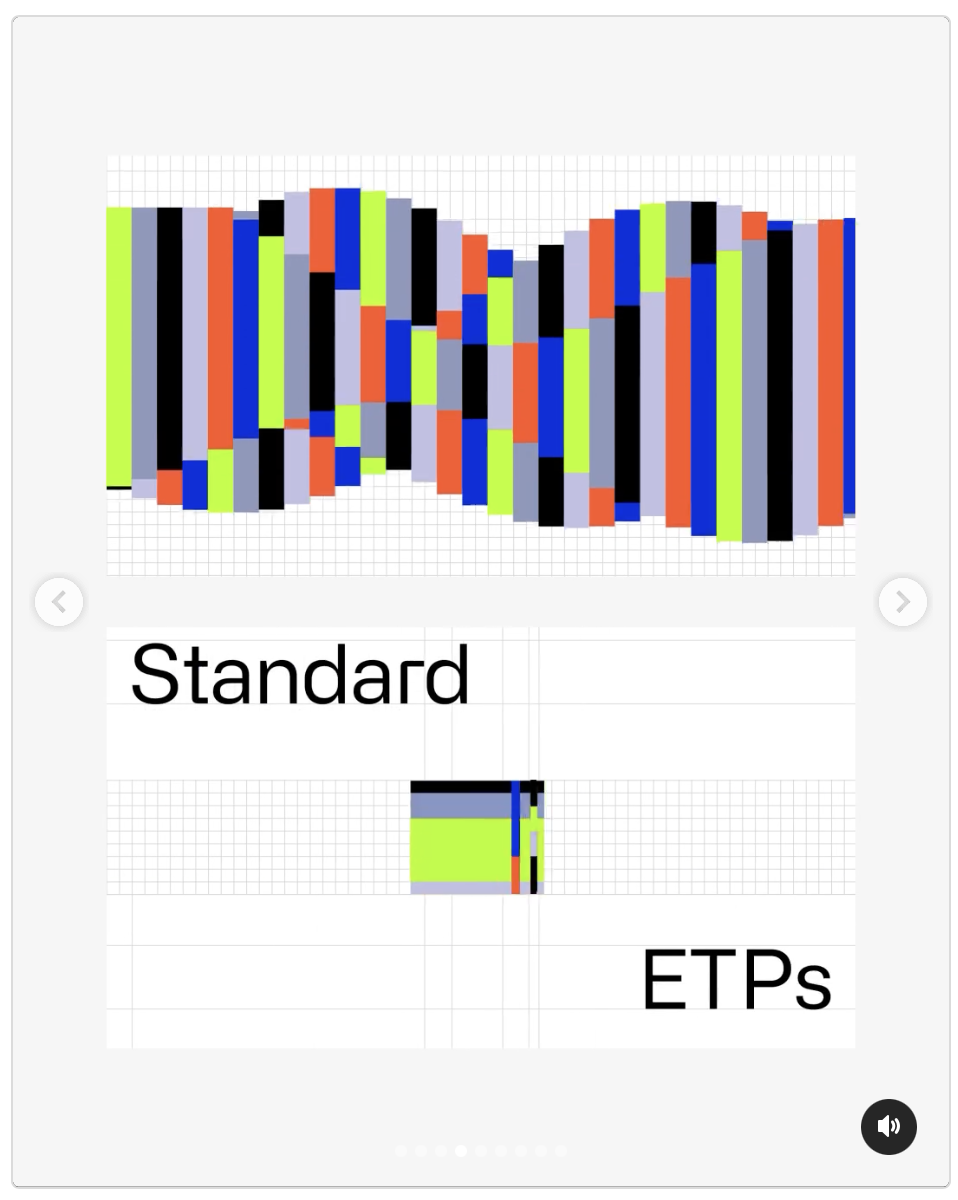
This image presents a clean, technical data visualization comparing two sets of metrics, 'Standard' and 'ETPs,' using a grid-based bar chart format. The design emphasizes clarity and quantitative comparison through distinct color coding and structured layout.
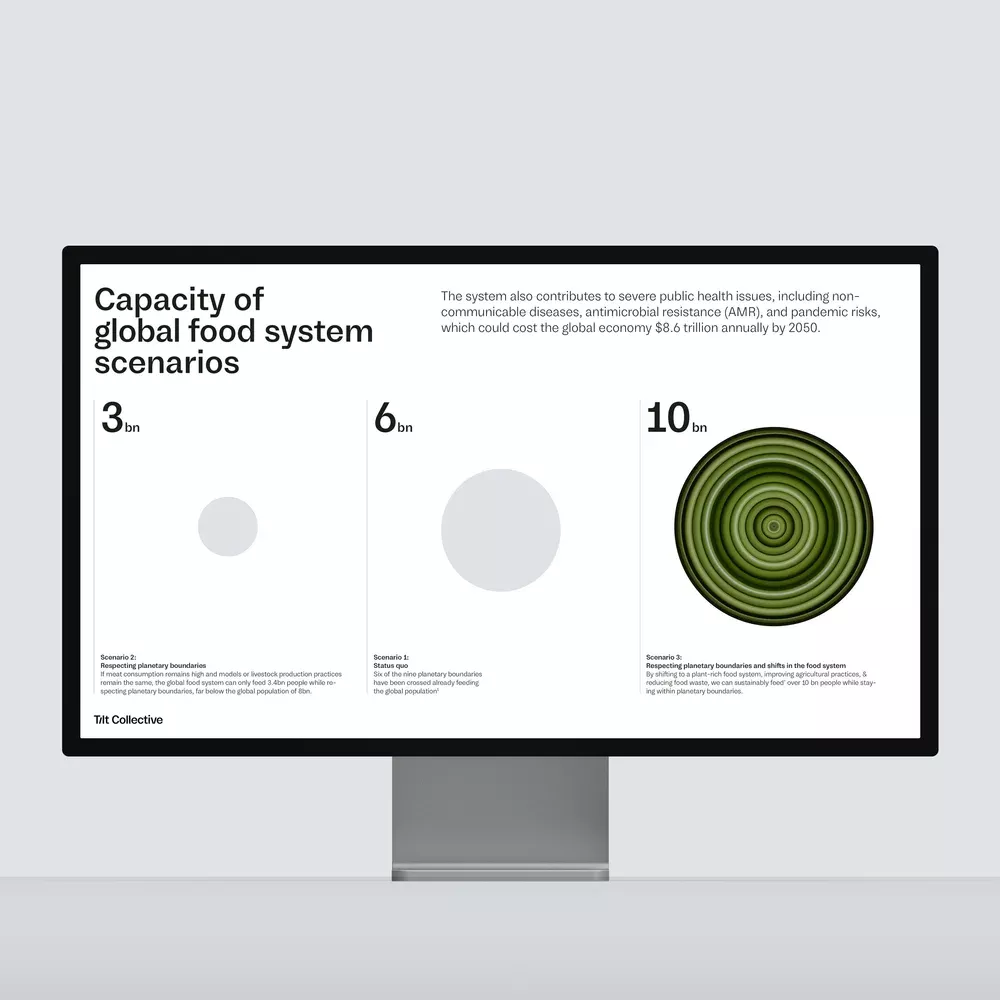
This is a clean, professional data visualization slide utilizing a minimalist design approach to present comparative scenarios. The visual language relies on stark contrast and simple geometric shapes to clearly communicate large numerical data points.
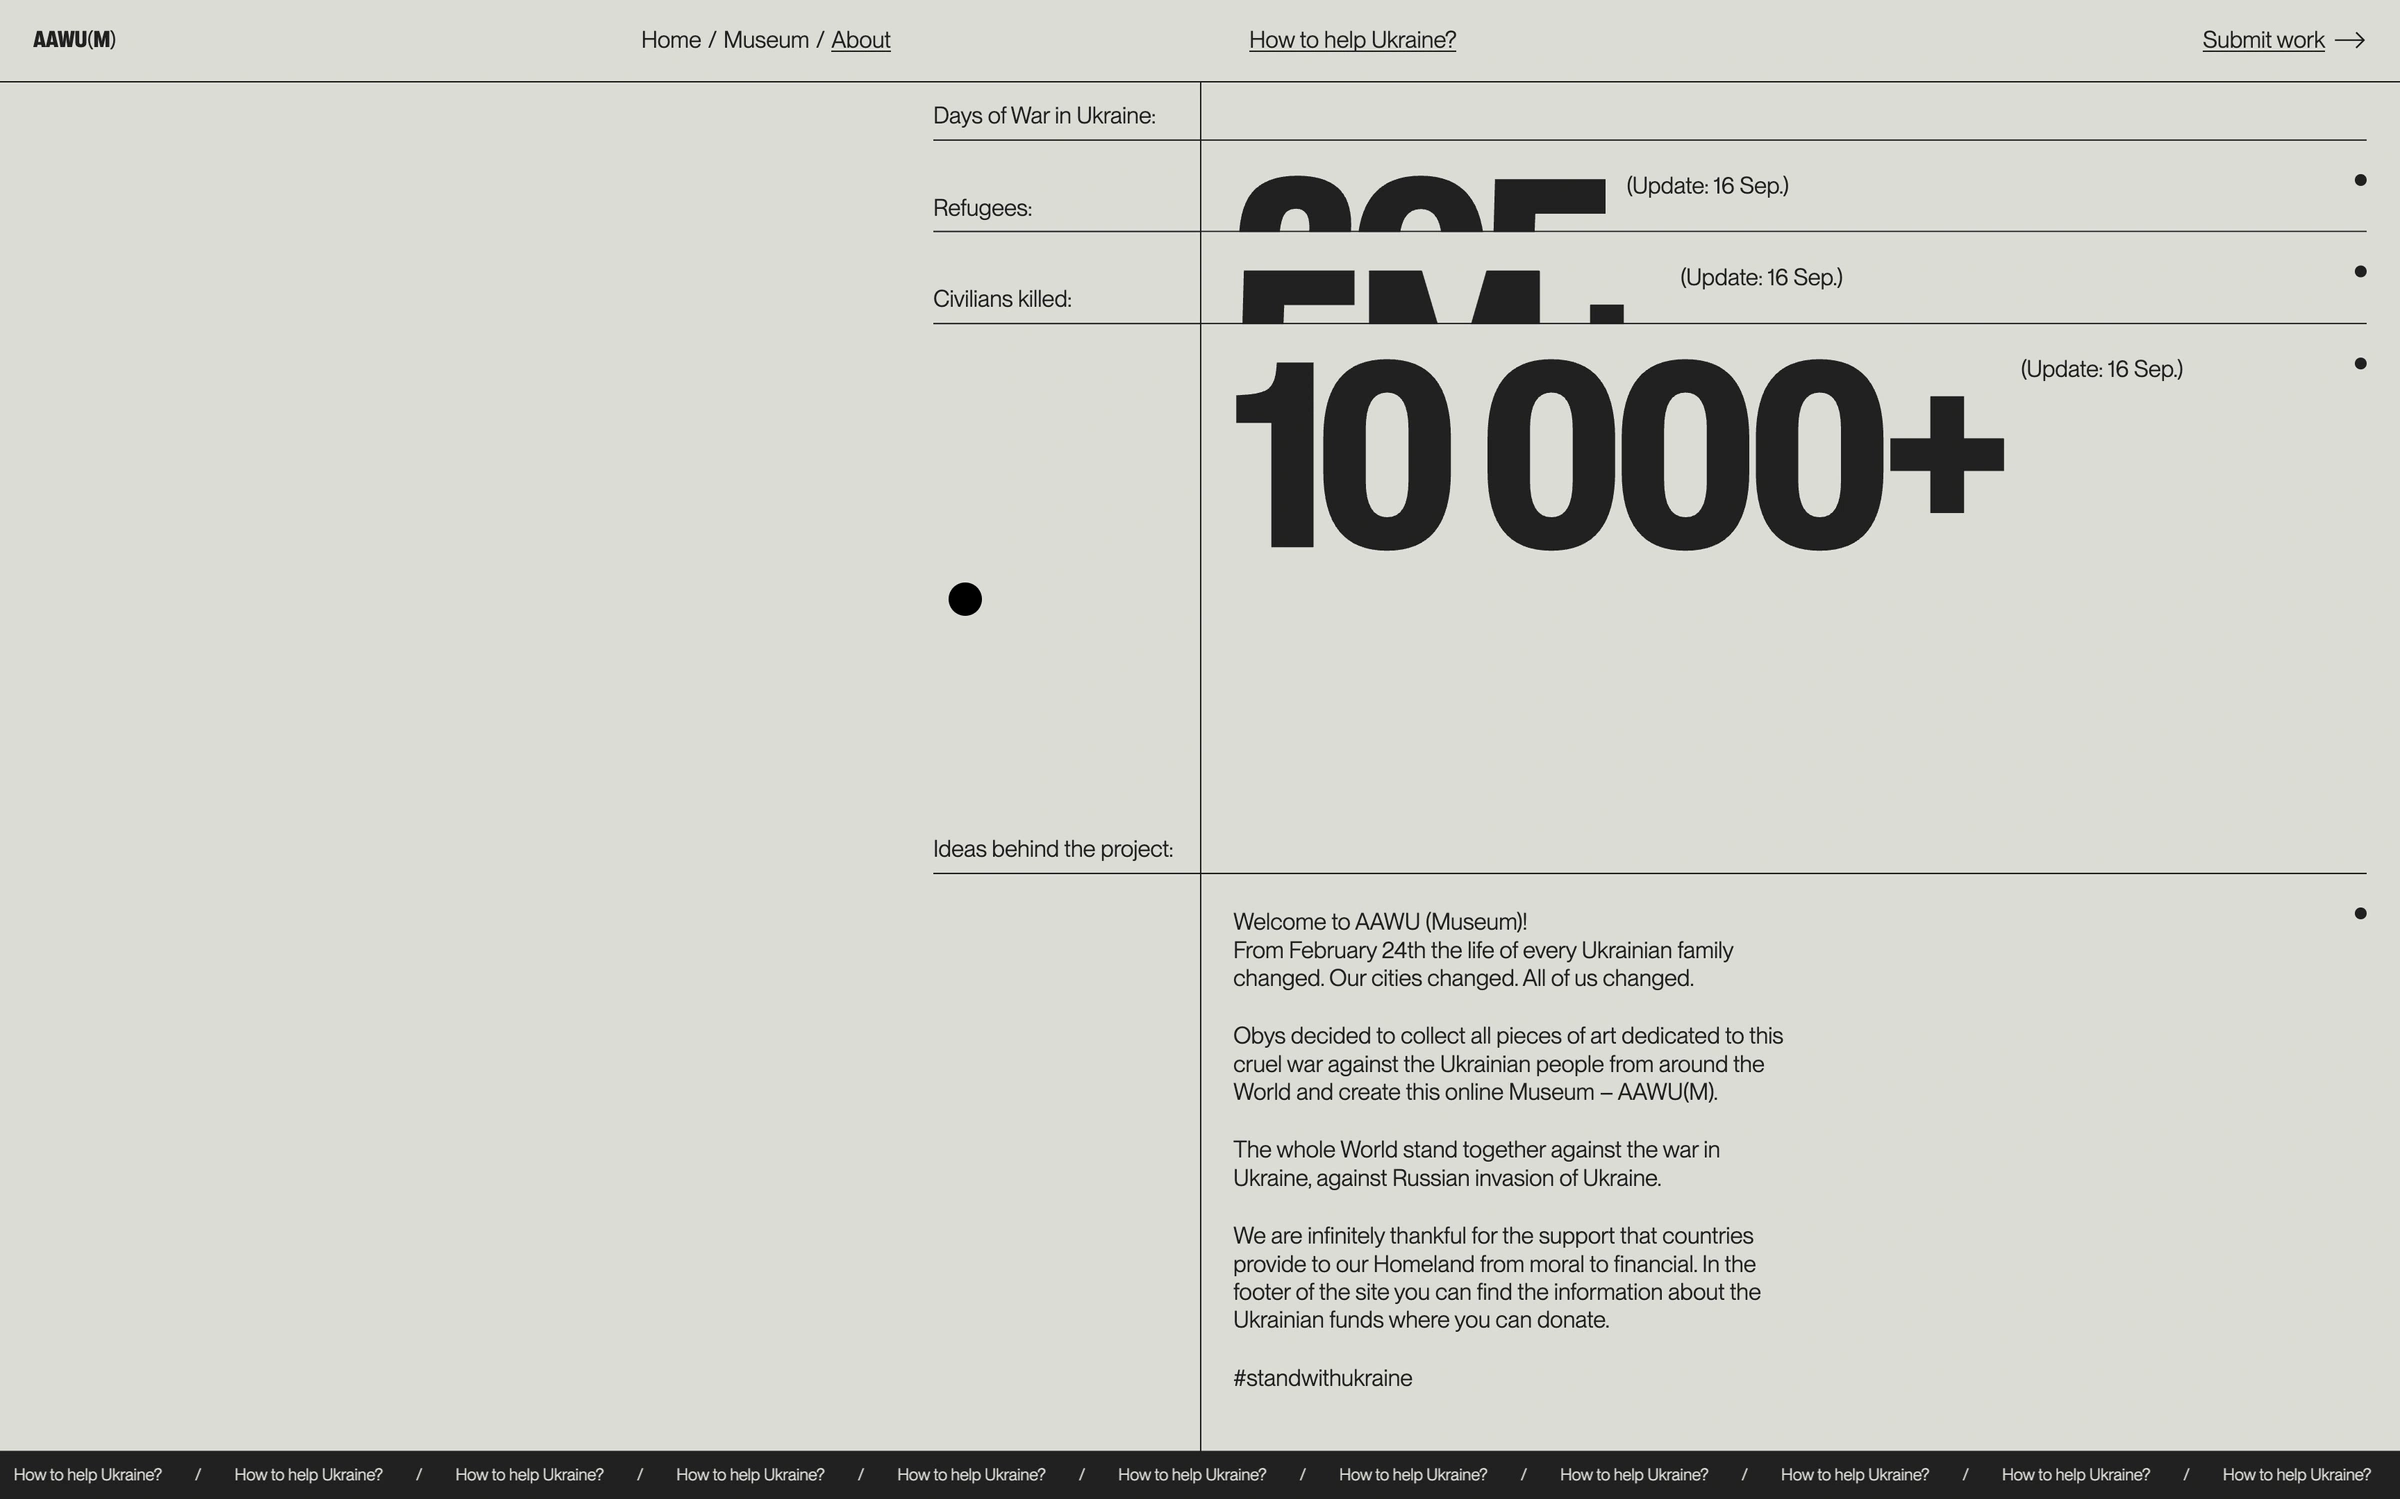
The design employs a stark, minimalist aesthetic characterized by high contrast and ample negative space to prioritize data presentation. The visual language is clean, objective, and direct, relying heavily on typography and simple lines to convey serious information effectively.
This design exemplifies clean, functional minimalism typical of academic or literary publishing. The visual language relies heavily on high contrast between black text and a white background to ensure maximum readability and professionalism. The overall feel is serious, organized, and highly objective.
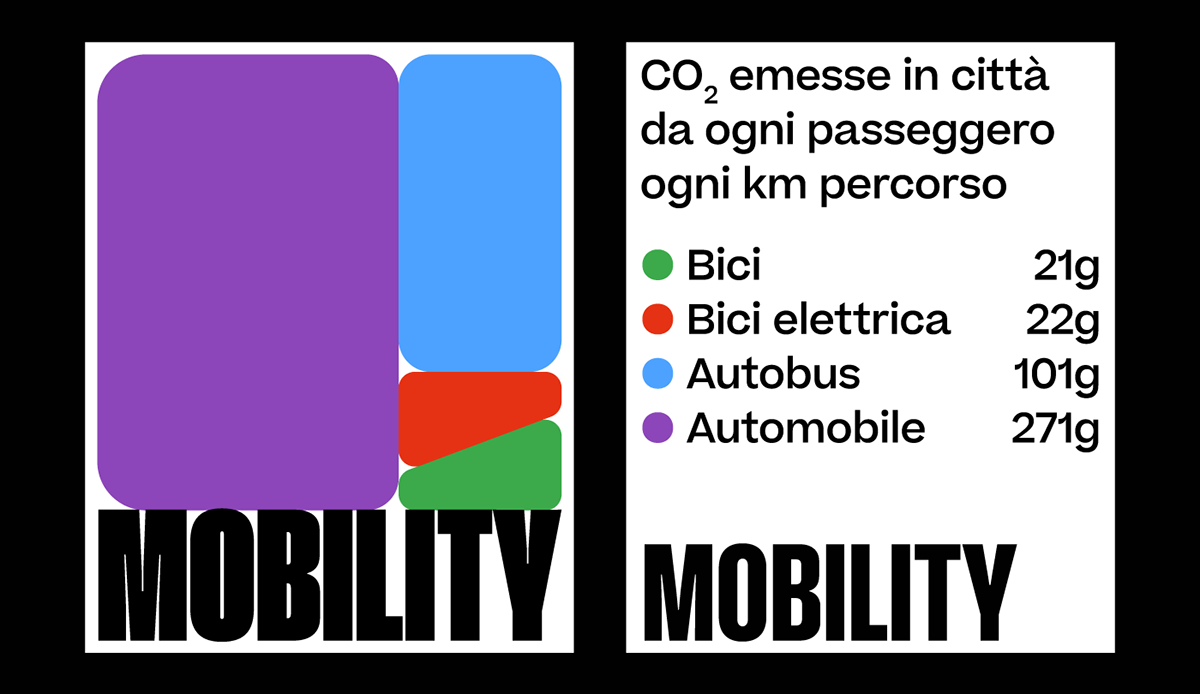
This graphic employs a clean, blocky design to present quantitative data related to urban mobility and CO2 emissions. The visual language is minimalist and relies on strong color blocking and clear typography to organize complex information effectively.
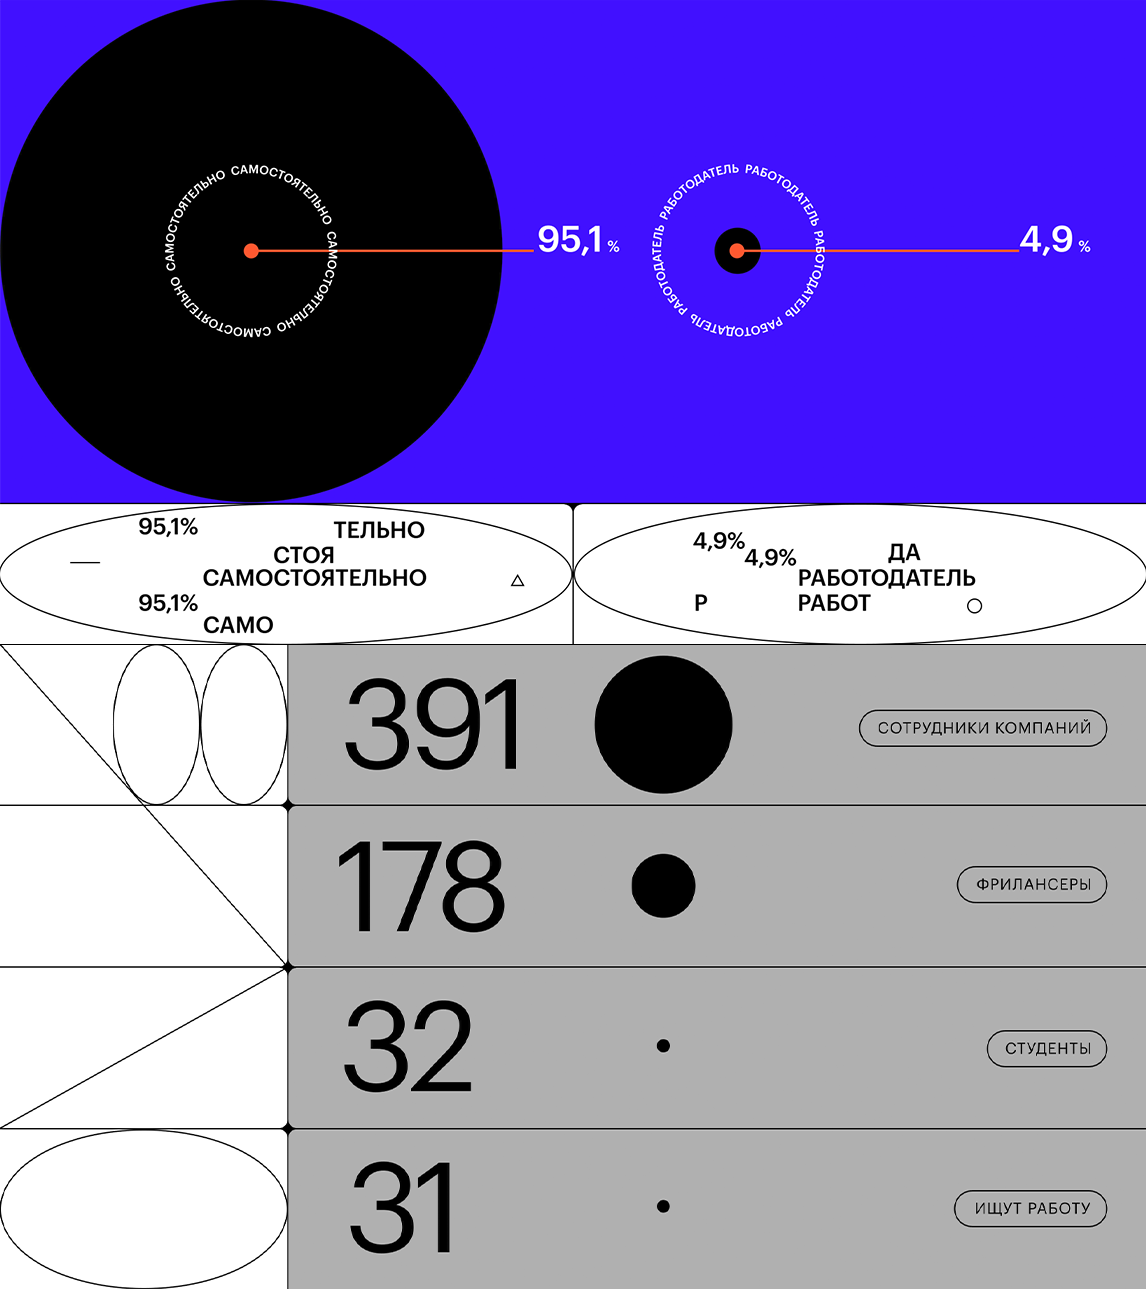
The image presents a stark, minimalist data visualization using a high-contrast color scheme against a deep blue background. It employs simple geometric shapes and clear percentage indicators to convey statistical information in a direct, analytical manner.
This image appears to be a technical drawing or a section from an architectural/engineering plan, characterized by stark black and white elements. The design is minimalist, focusing on precise geometric shapes and clear delineation of space or measurement.
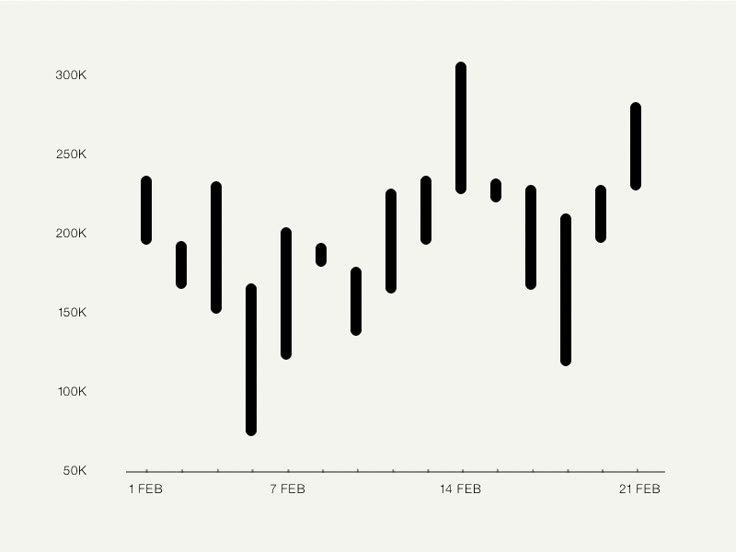
This is a line chart displaying fluctuating data points over time, characterized by a stark, minimalist design focused purely on the visual representation of the trend. The chart uses high contrast between the black data line and the light background to emphasize volatility in the measured values.
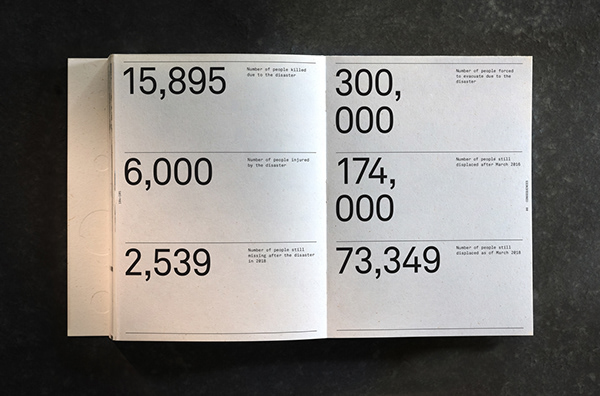
This image displays a stark, minimalist data presentation, likely from a report or book, characterized by high contrast and clean typography. The design prioritizes the clear, quantitative display of severe statistics, lending it an objective and serious tone.
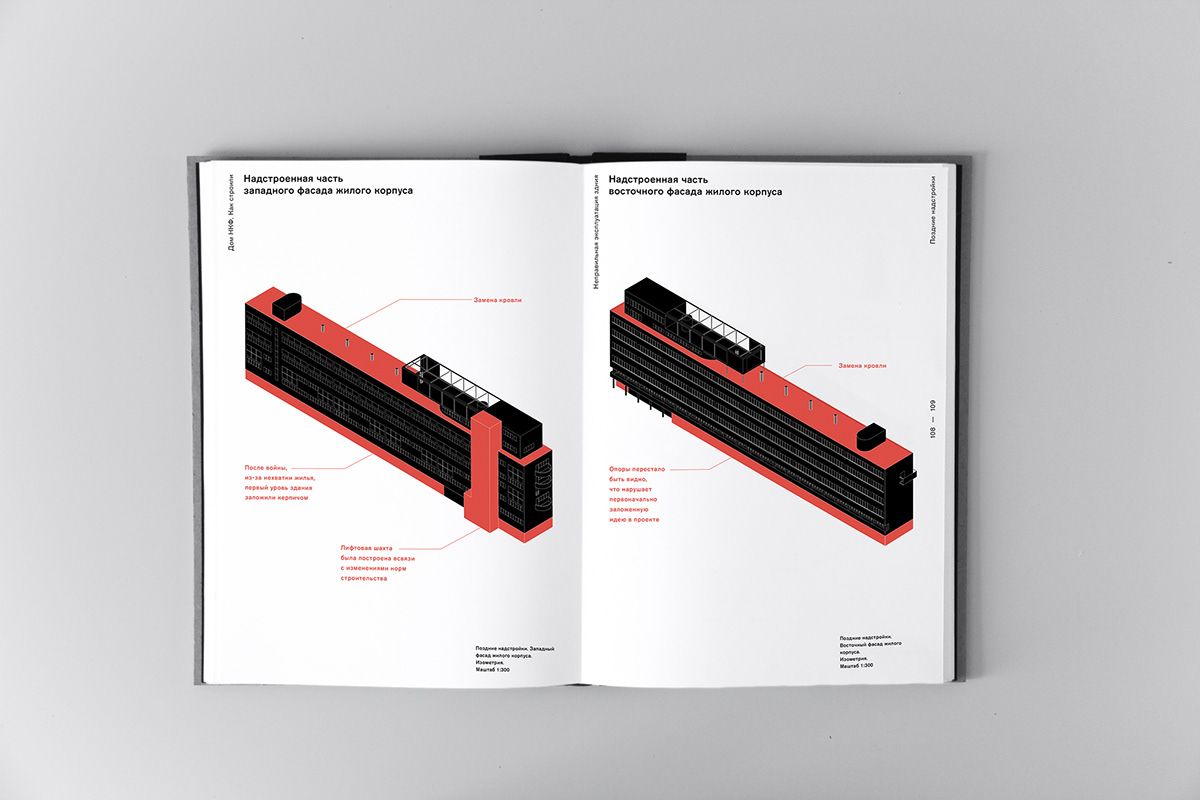
The image displays technical or architectural drawings, likely cross-sections or elevations of a building facade, presented in a clean, technical diagrammatic style. The visual language is precise and functional, emphasizing structural elements through clear lines and labels.
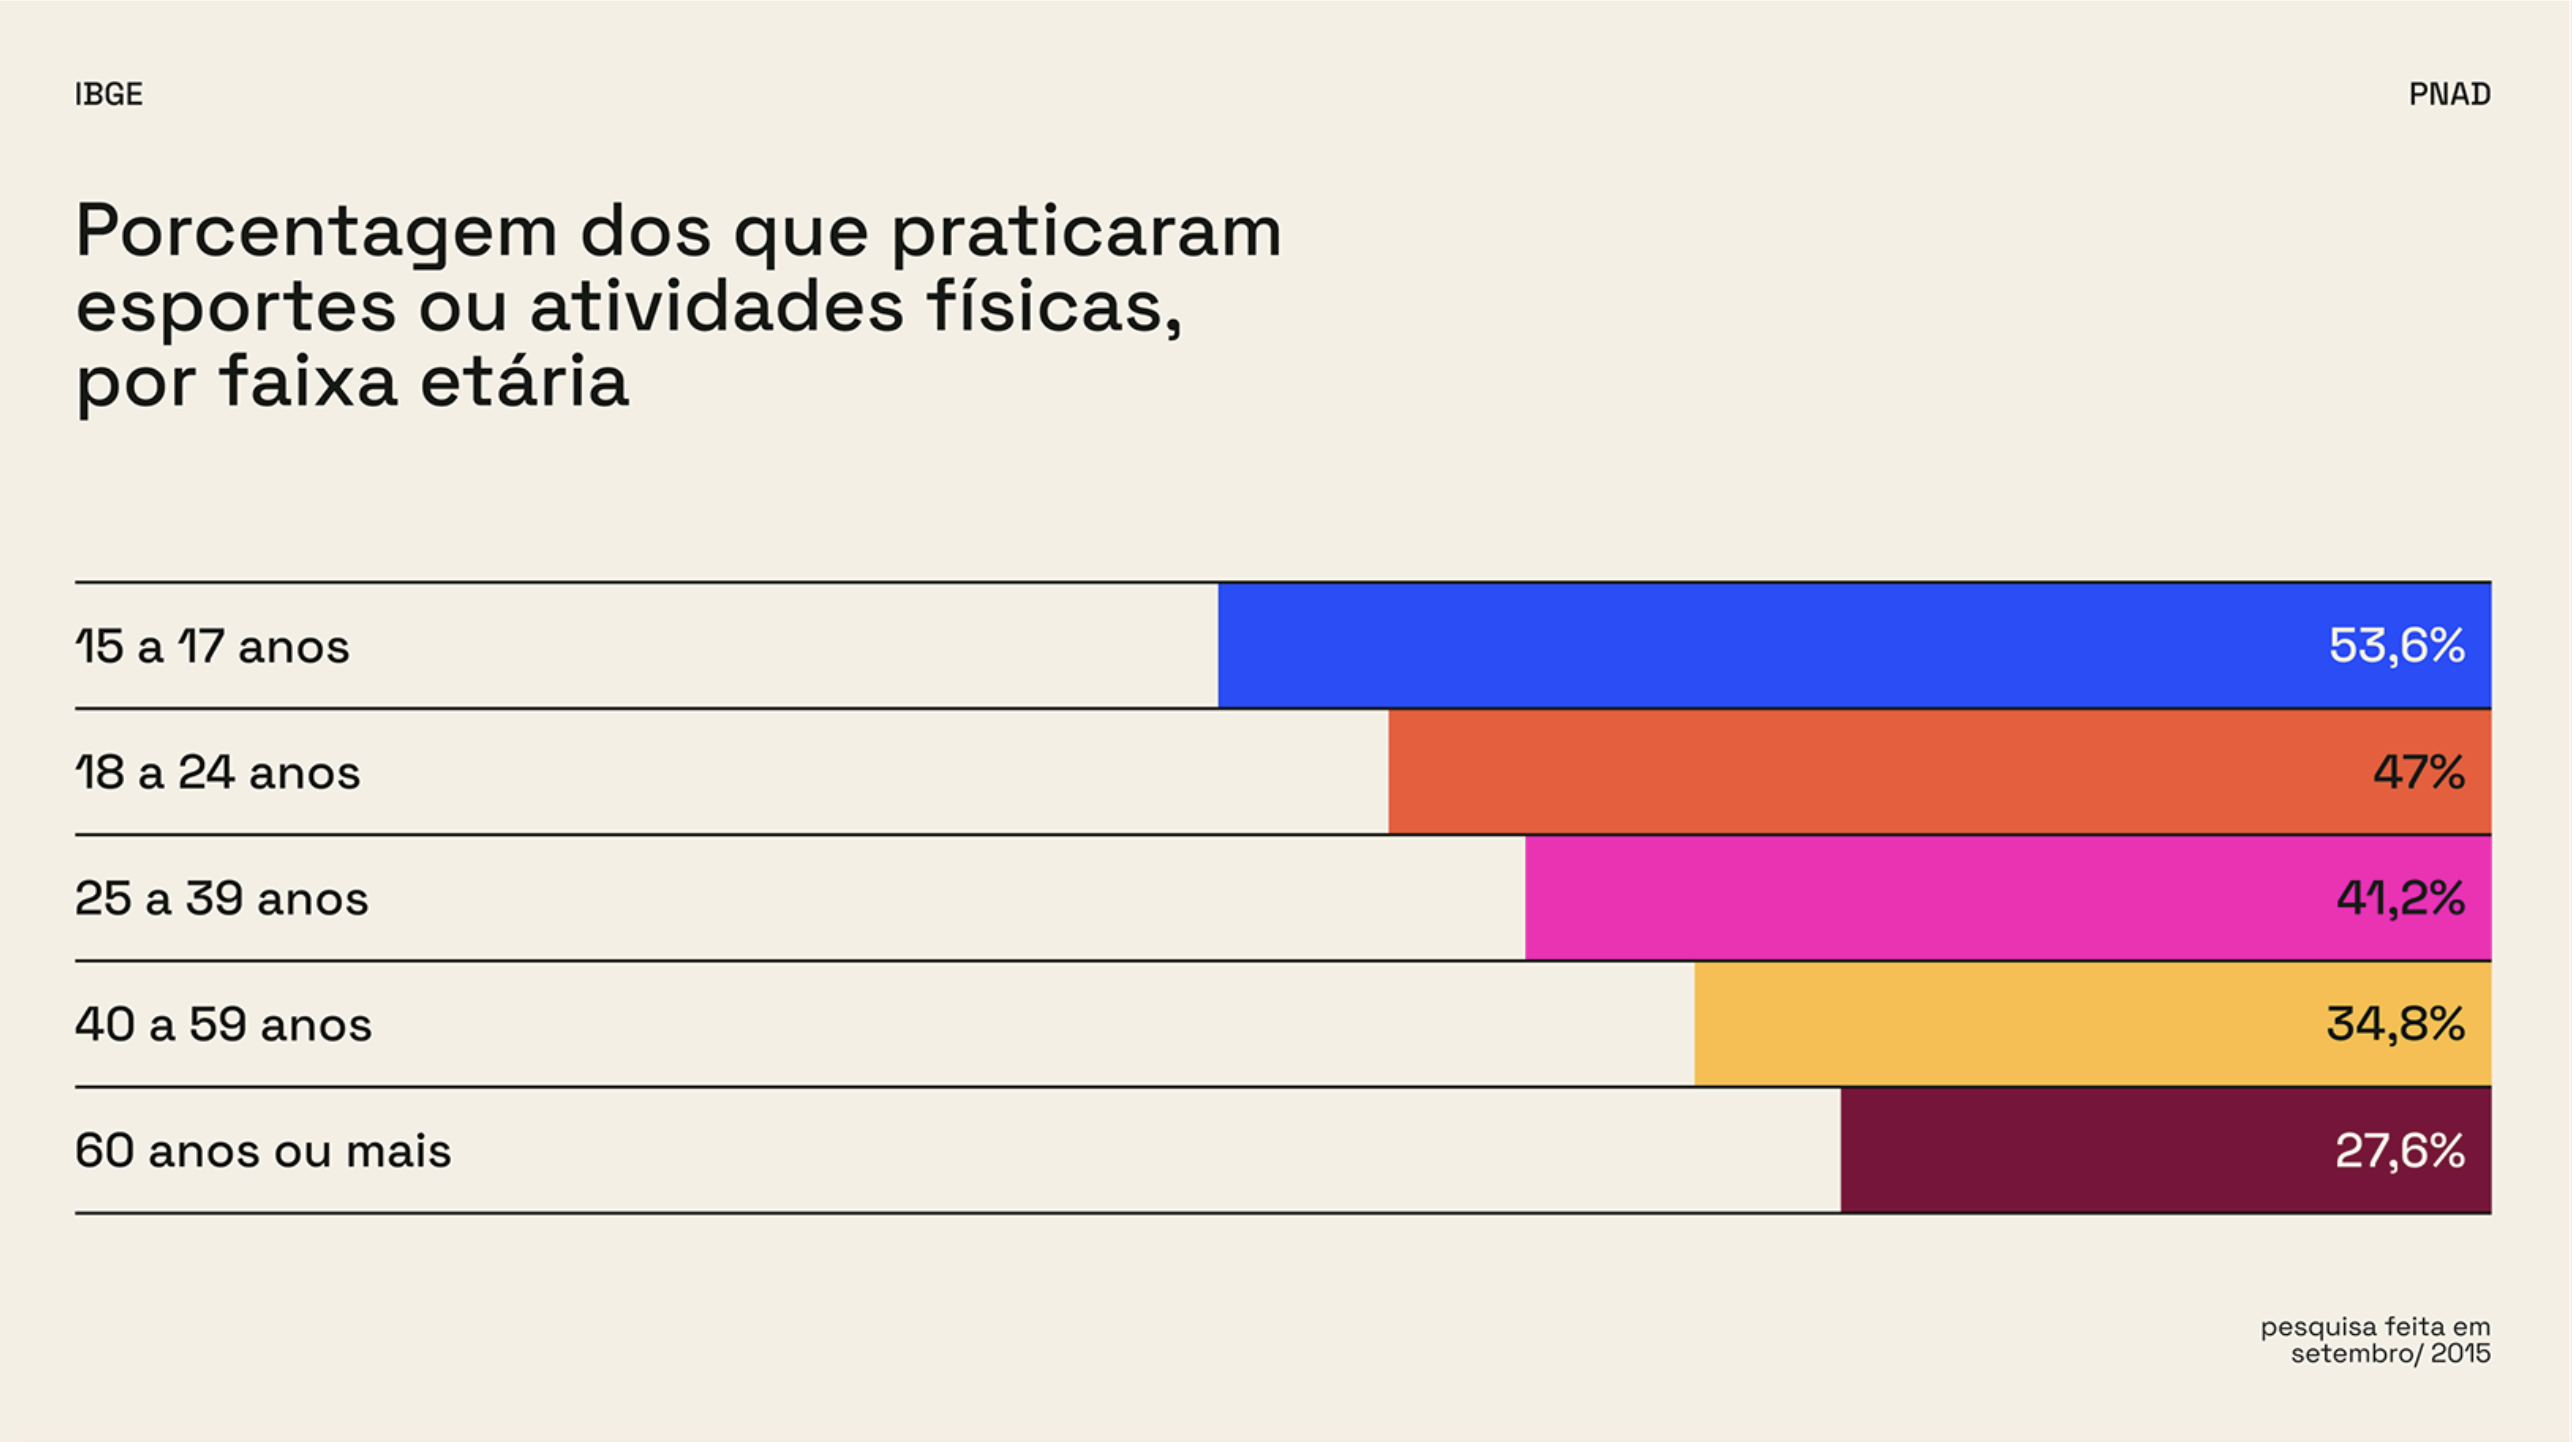
The image is a clear, data-driven bar chart visualization presenting the percentage of people who practice sports or physical activities categorized by age group. The design is clean, minimalist, and highly functional, prioritizing readability of the statistical information.
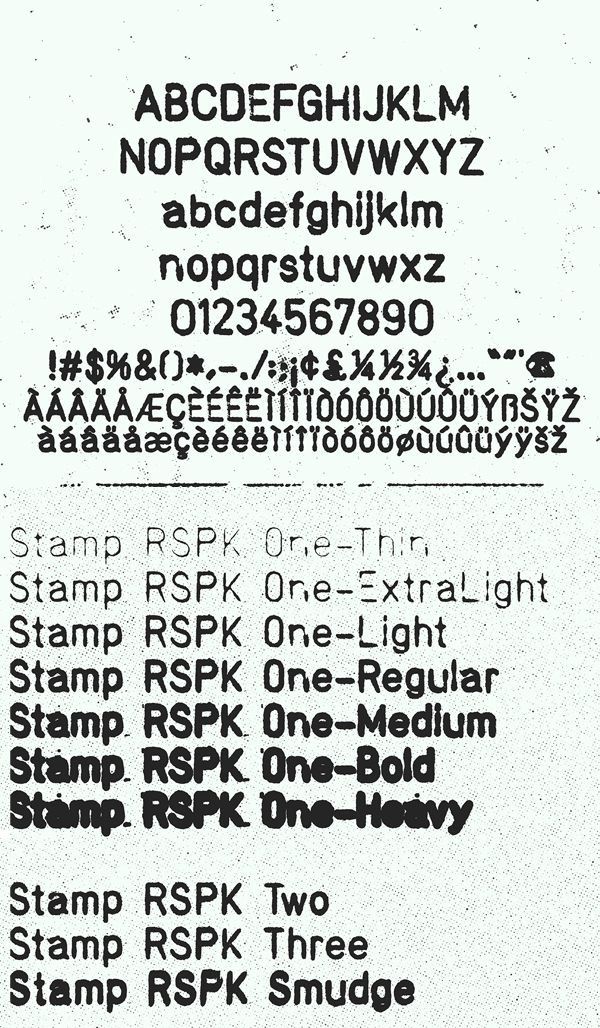
This image presents a stark, utilitarian display of alphanumeric characters and various stamp variations, suggesting a technical or archival context. The design relies heavily on simple, high-contrast text to convey specific designations and weights.
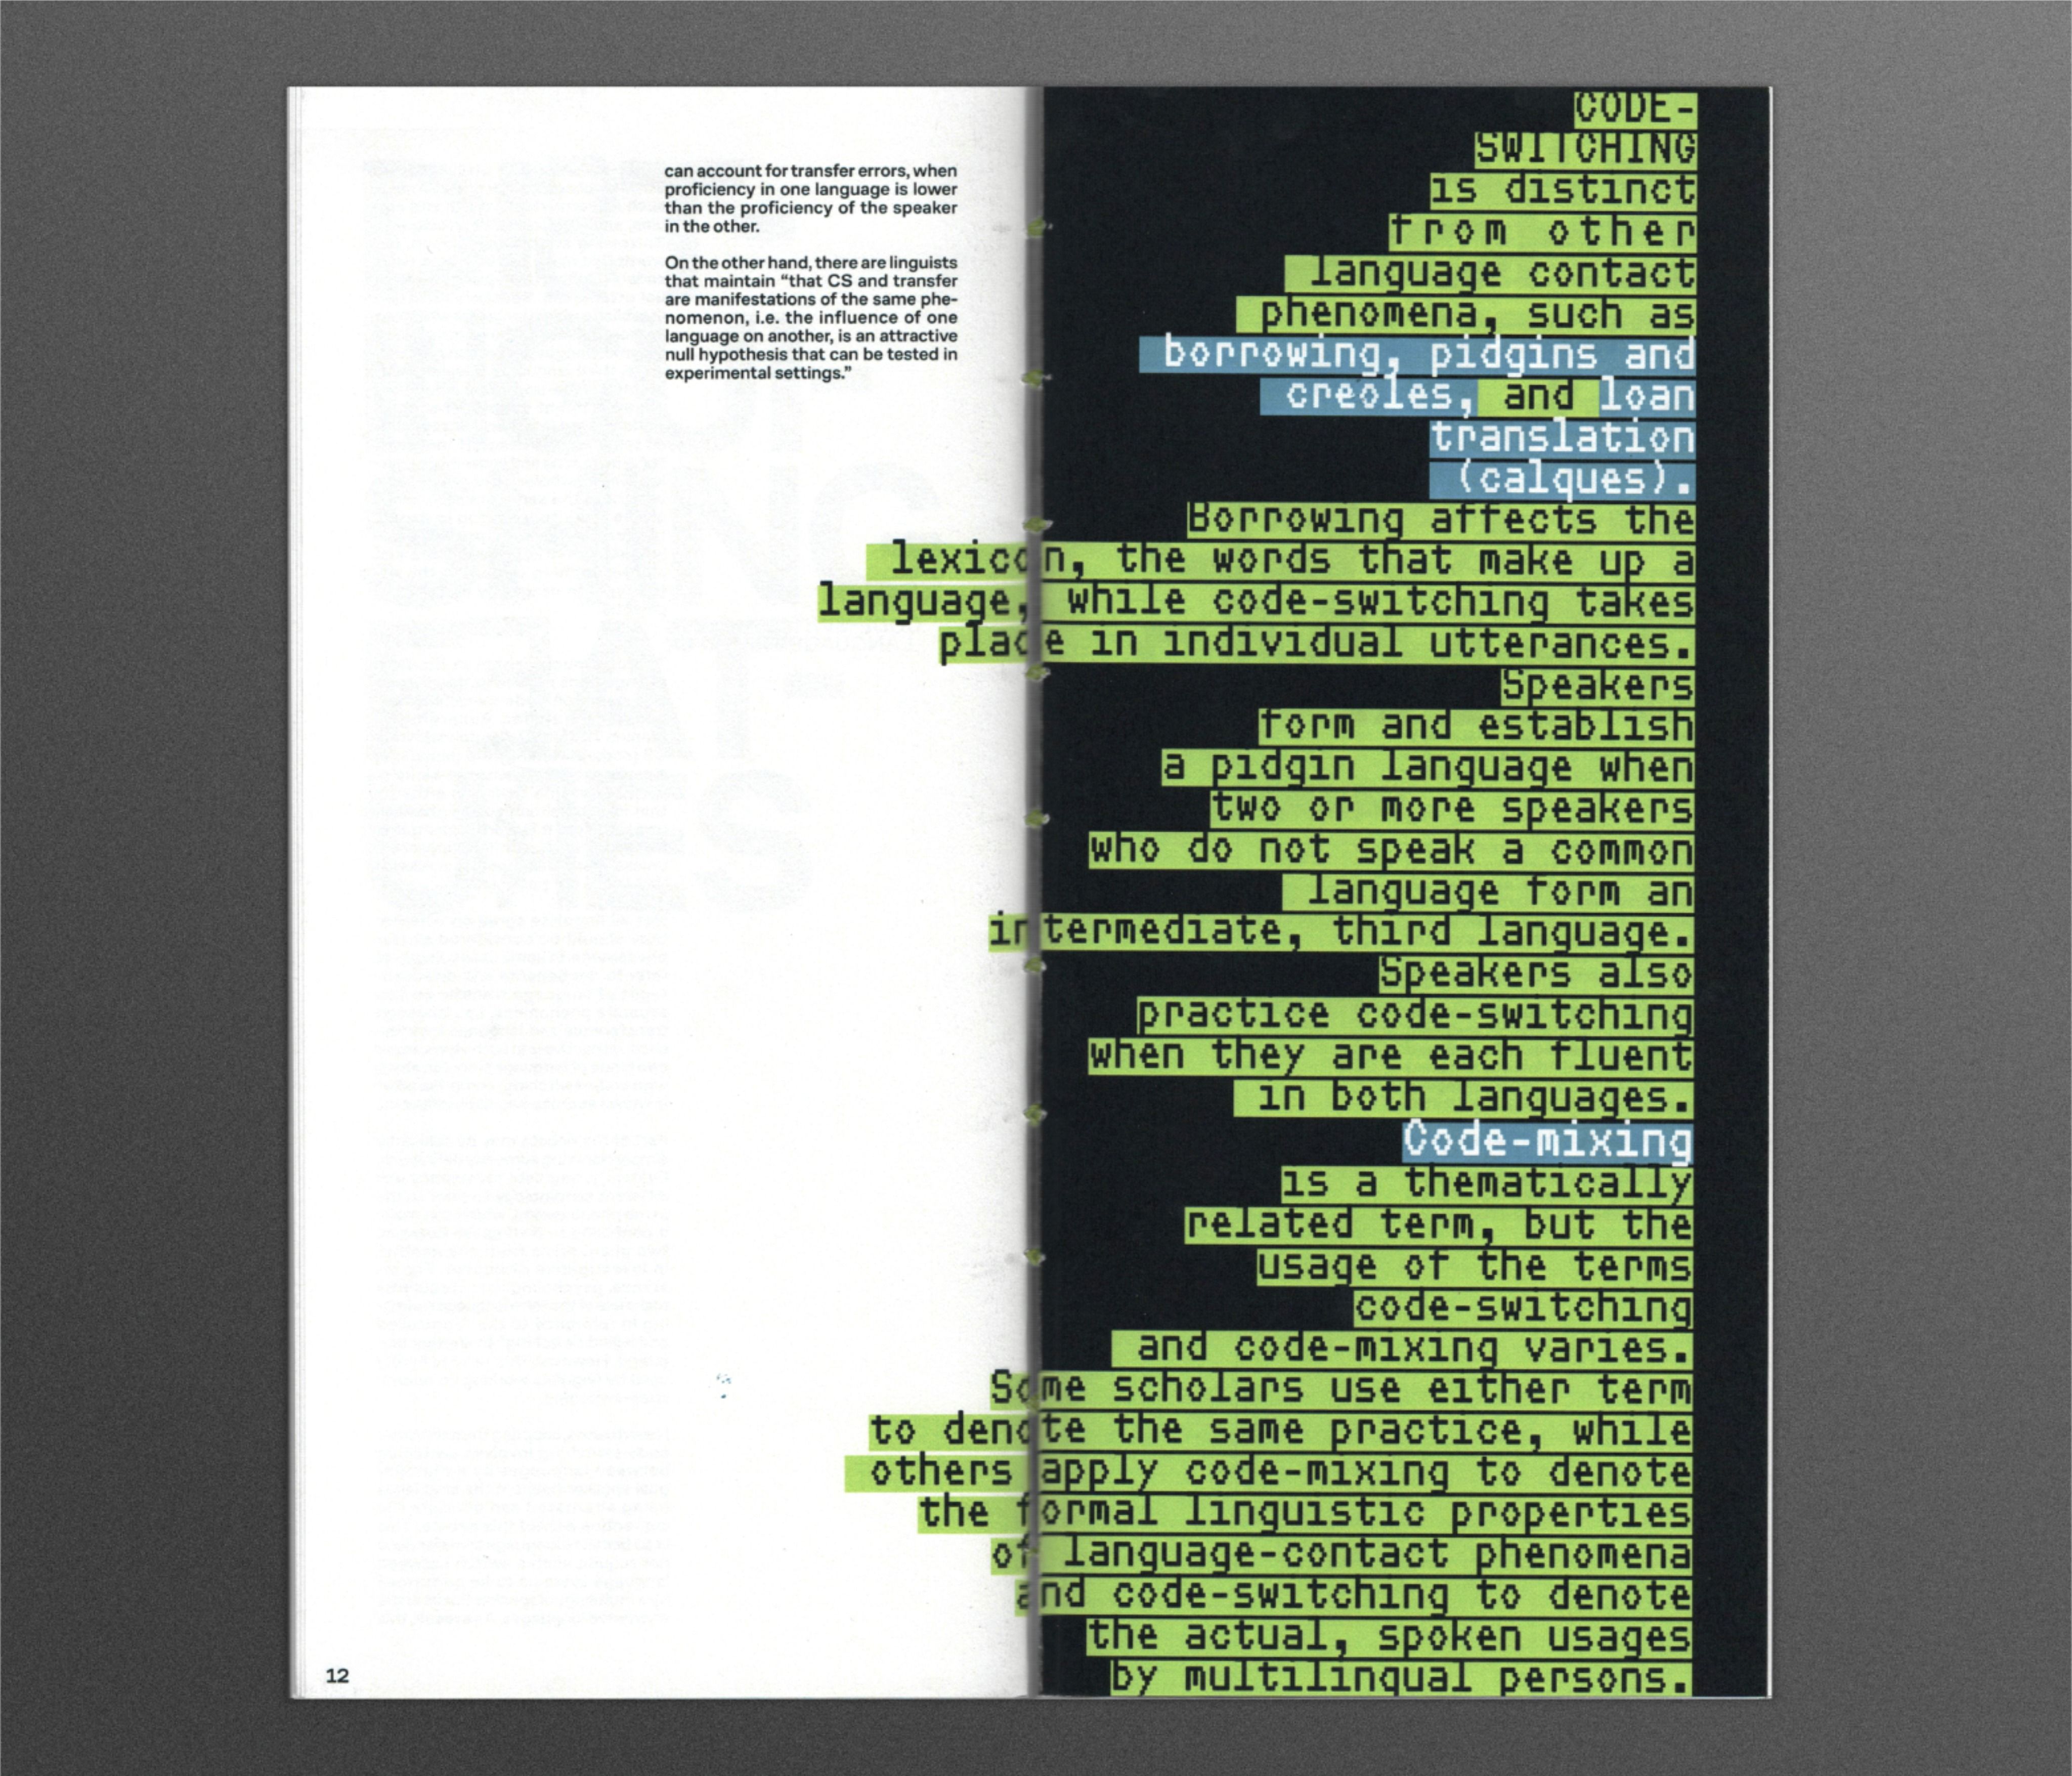
The image presents a dense block of black text on a white background, suggesting an academic or technical document excerpt. The design is purely functional and minimalist, relying entirely on typography to convey information.
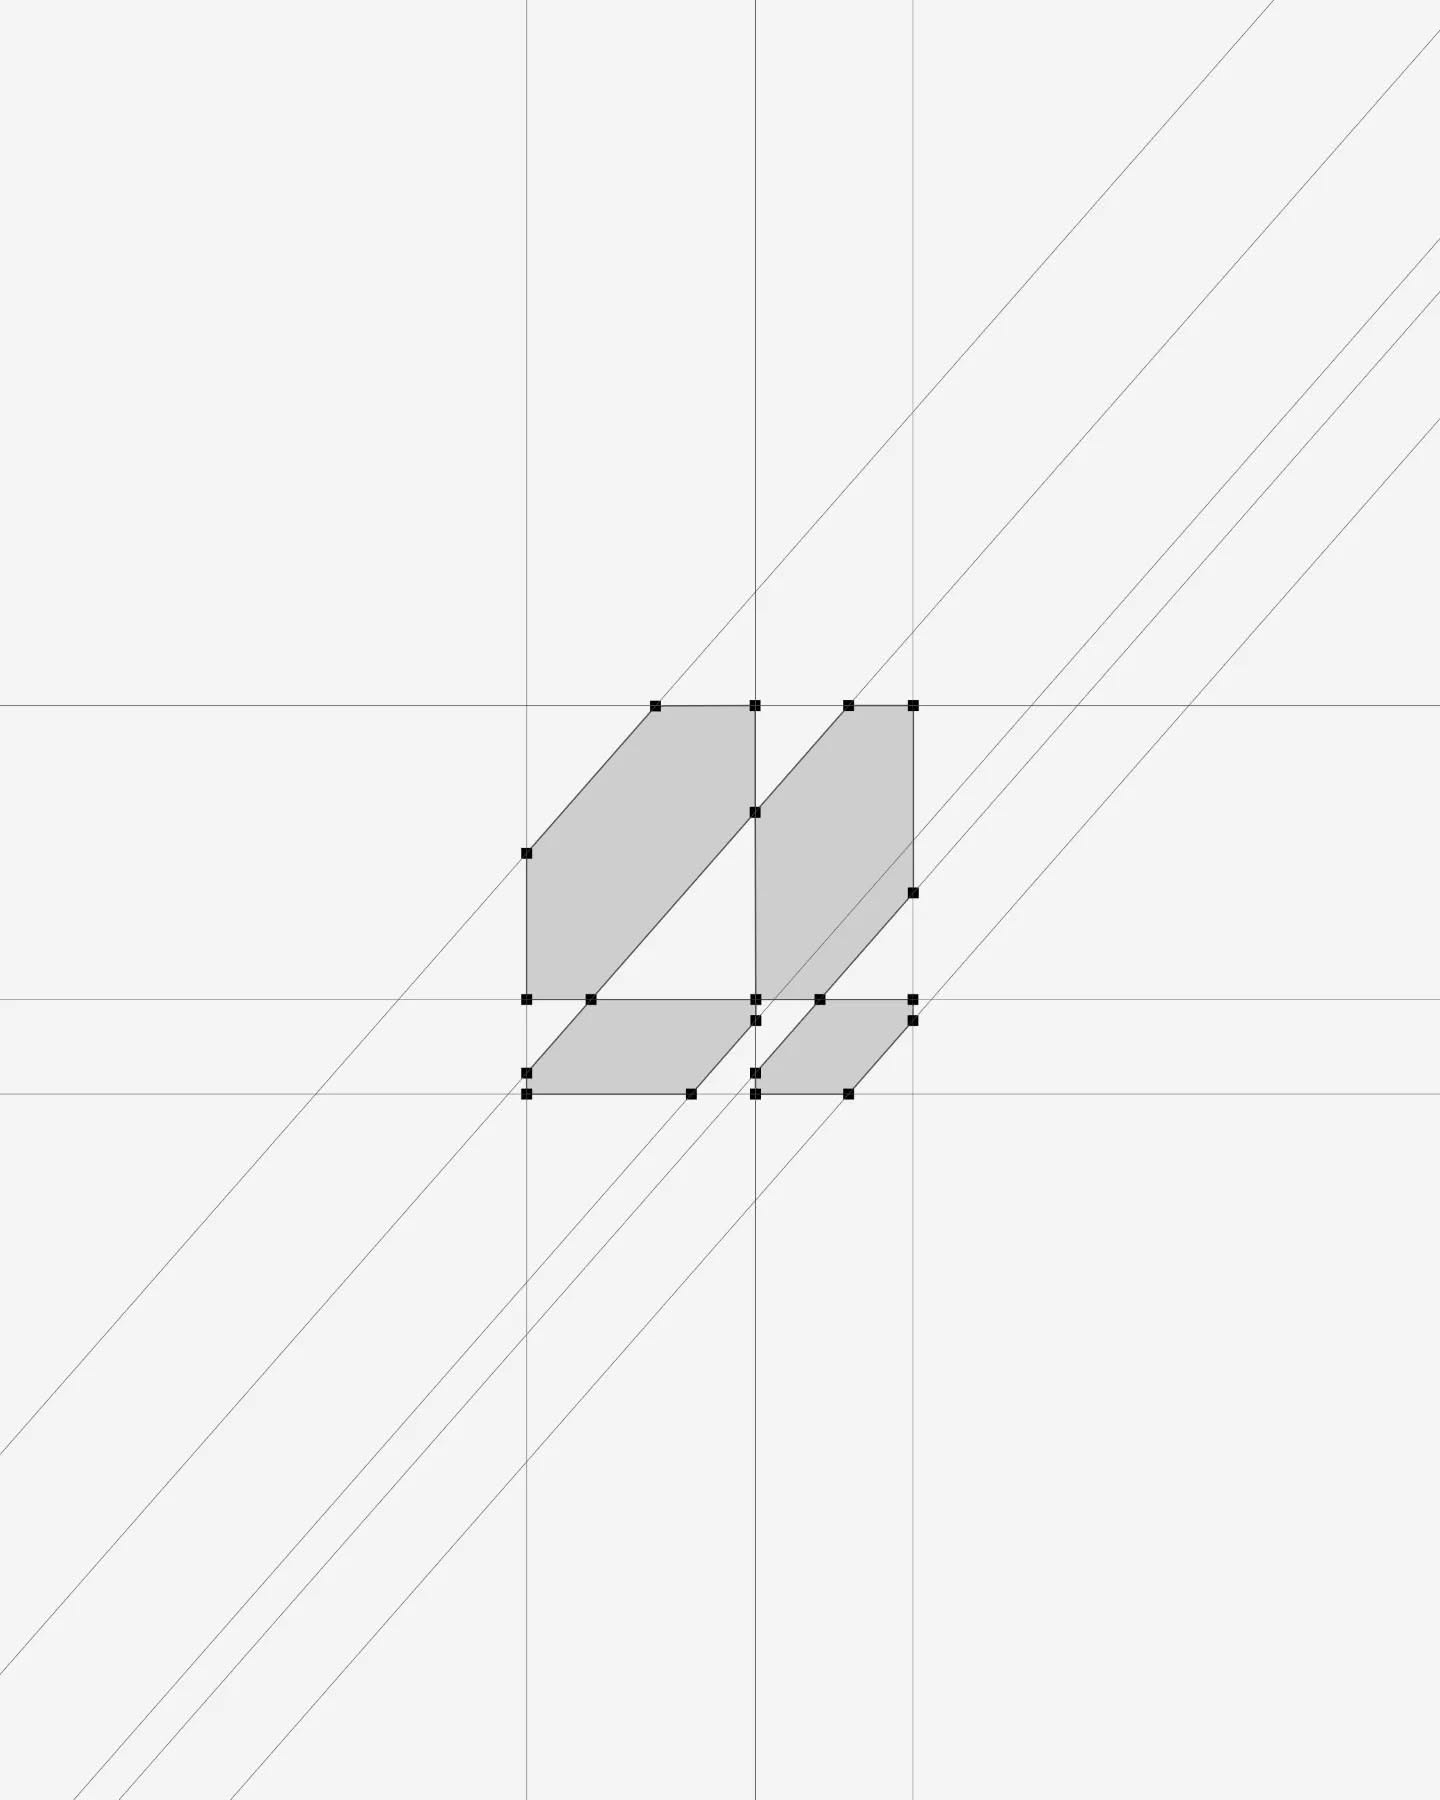
The image is a schematic diagram featuring a grid structure intersected by diagonal lines, highlighting a specific quadrilateral shape formed by intersecting lines. The visual language is purely geometric and analytical, suggesting precision and spatial relationships.
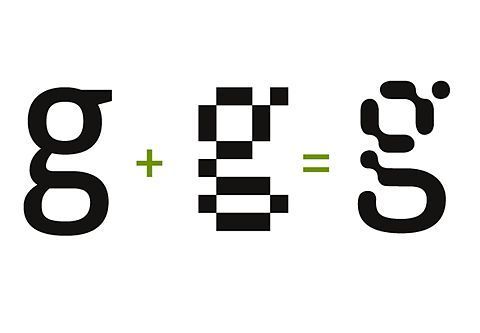
This image presents a minimalist mathematical or symbolic operation using stylized, blocky glyphs. The design relies on high contrast between black and white to clearly define the components of the equation, resulting in a clean, technical, and precise visual statement.
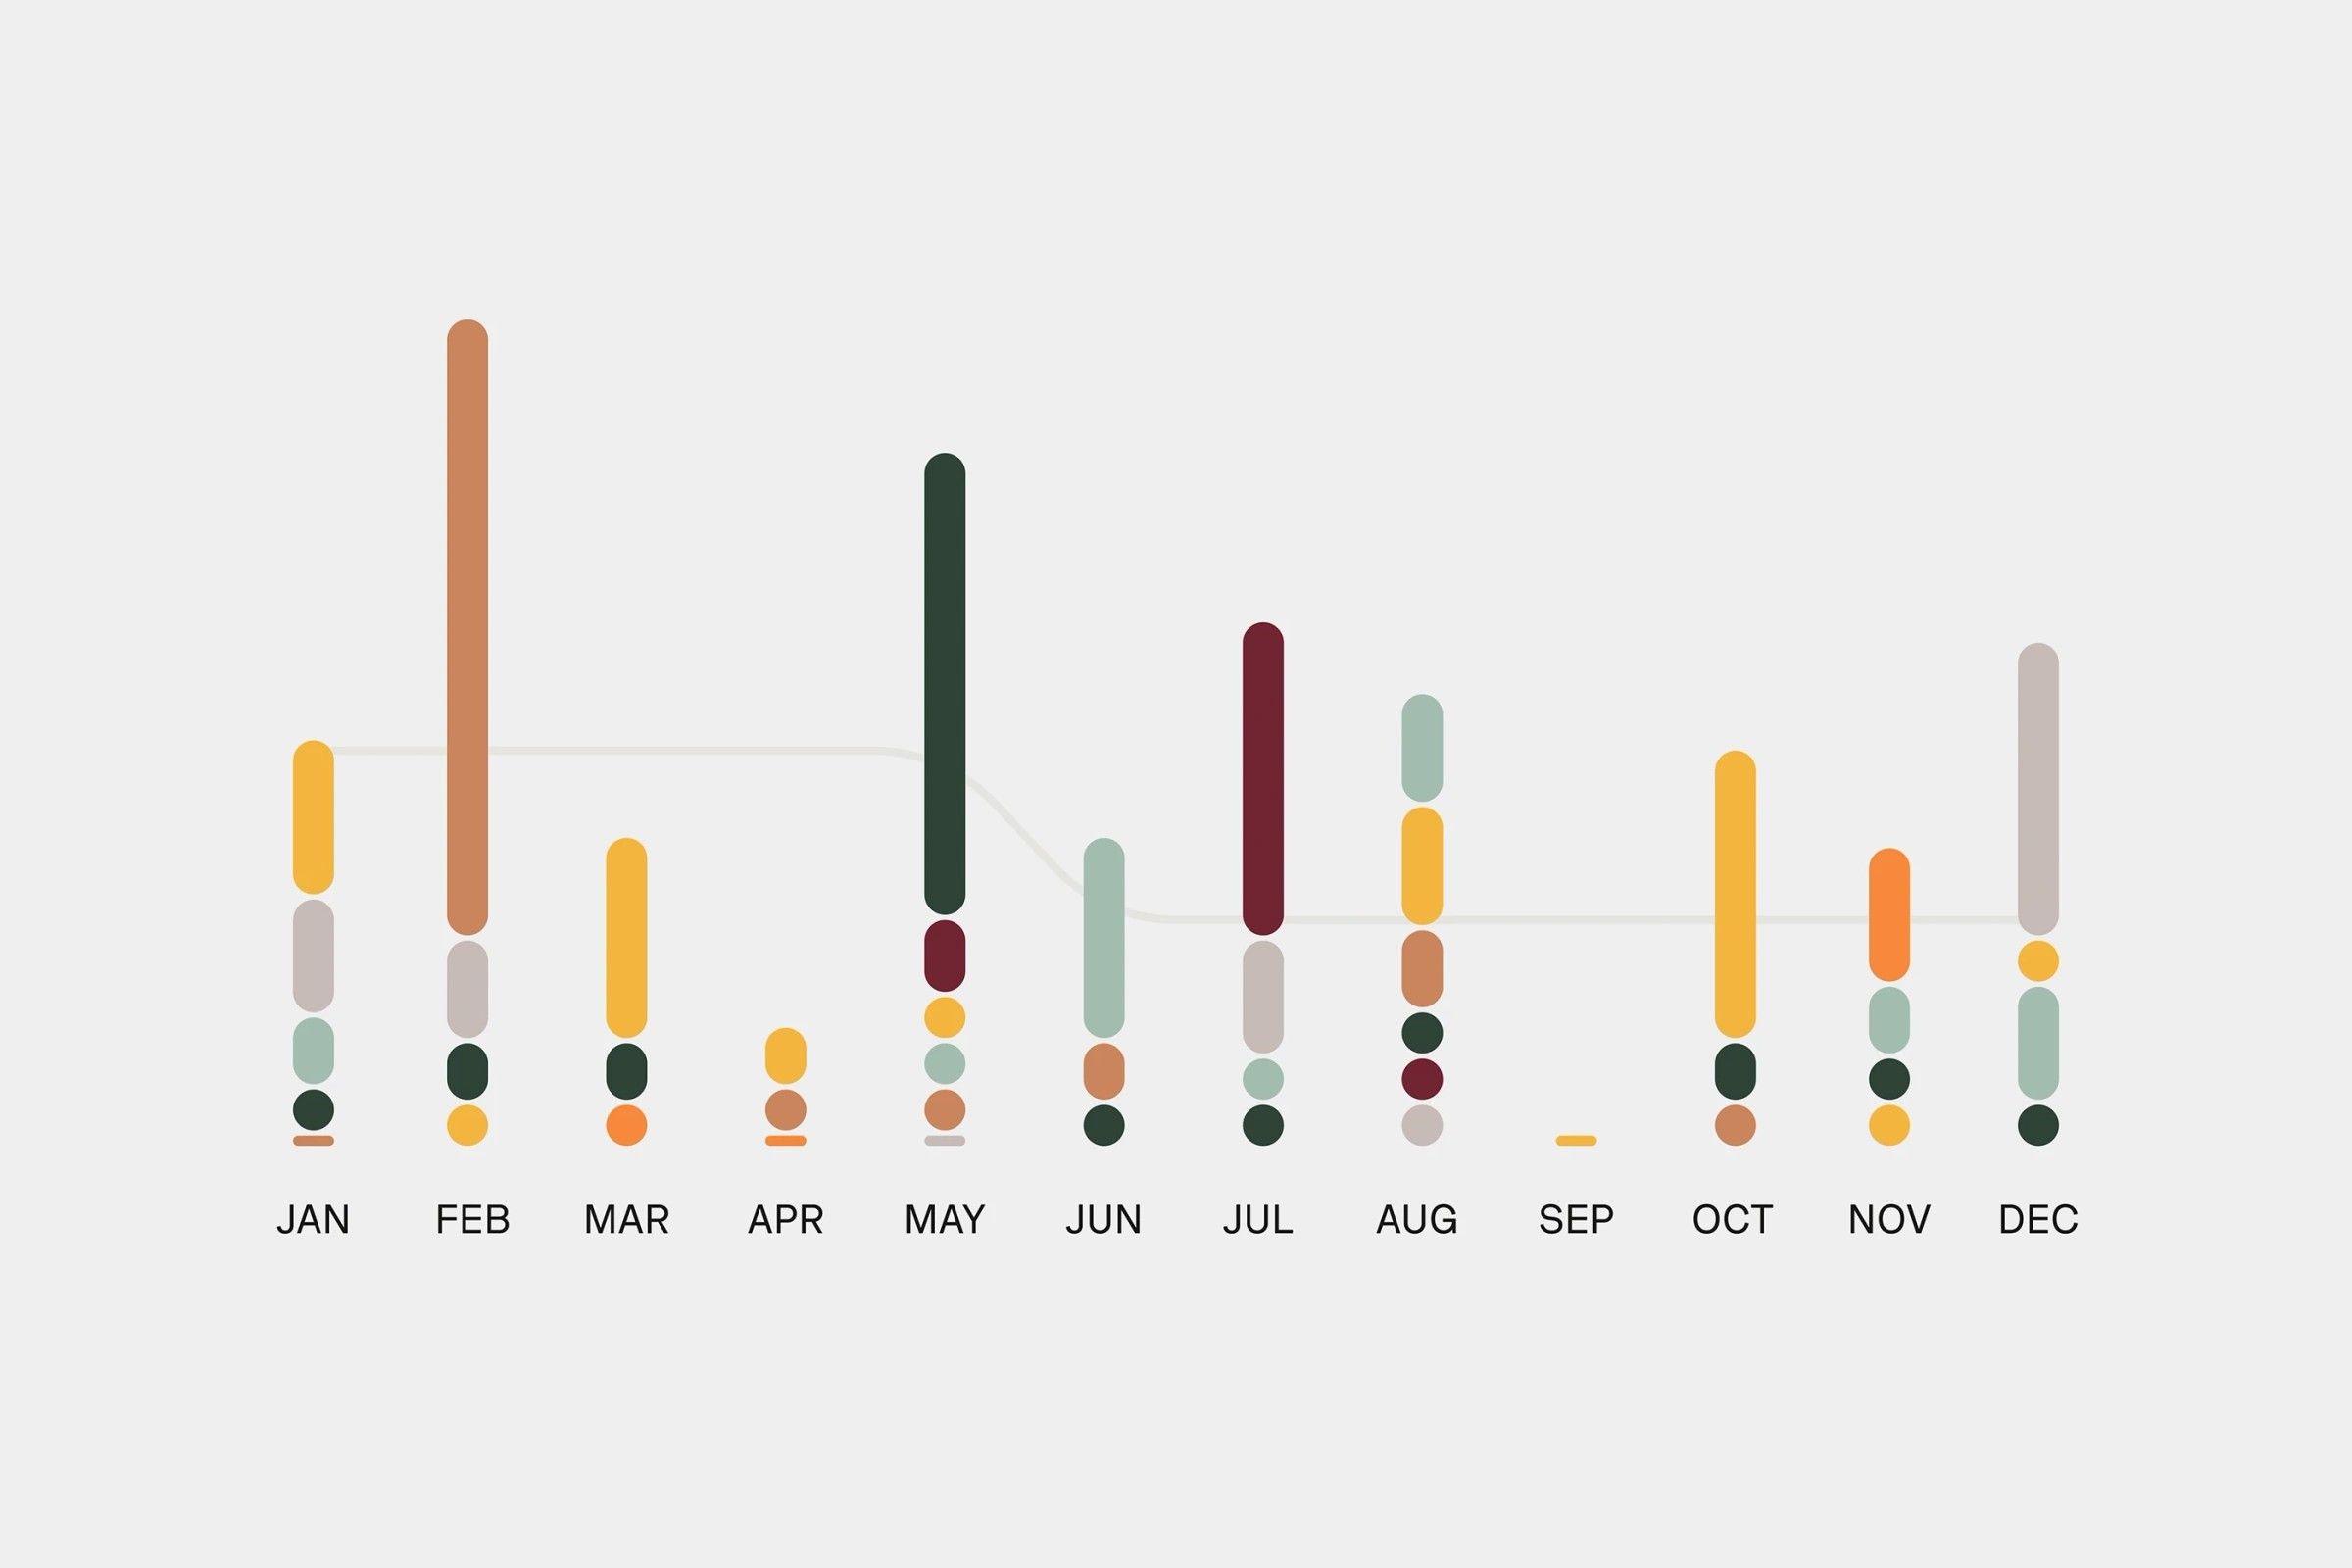
This is a minimalist, data-driven visualization using vertical bar charts to display monthly data points. The design relies heavily on color variation within a muted, neutral background to convey quantitative information clearly and cleanly.
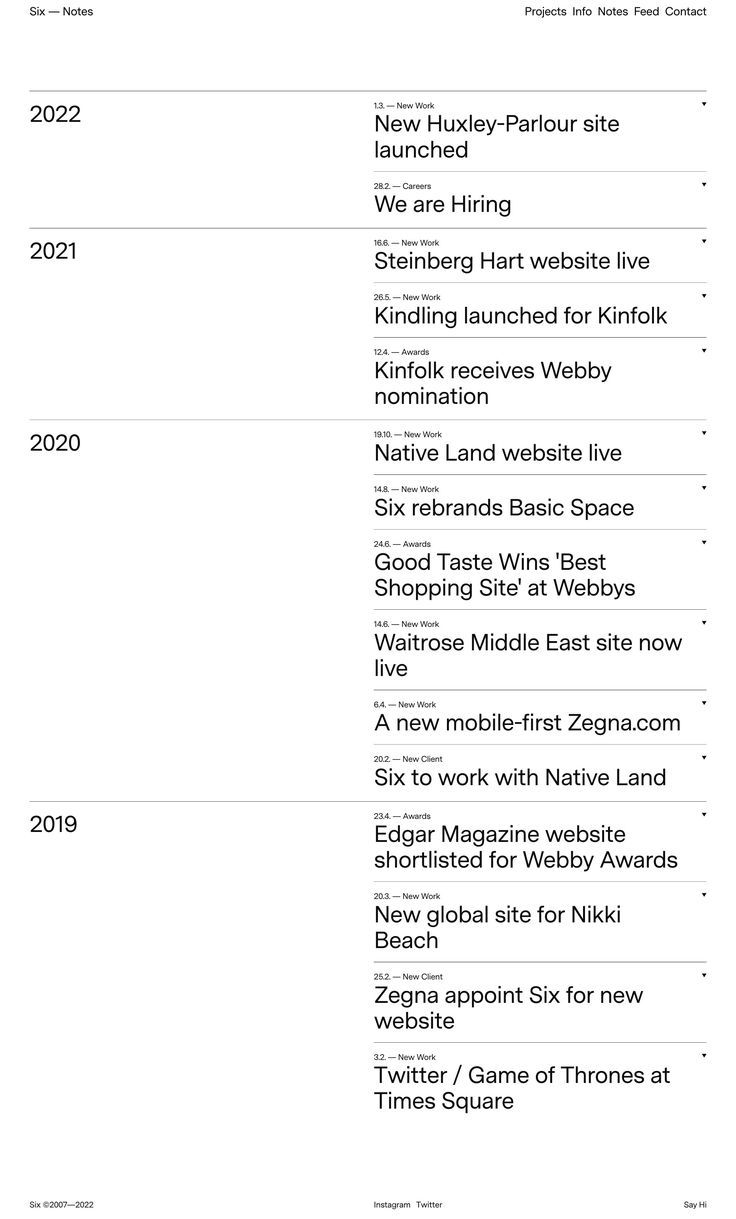
The image presents a clean, minimalist, and text-heavy chronological list of projects or notes, suggesting a professional portfolio or archive. The design relies heavily on white space and simple black text to convey information clearly and formally.
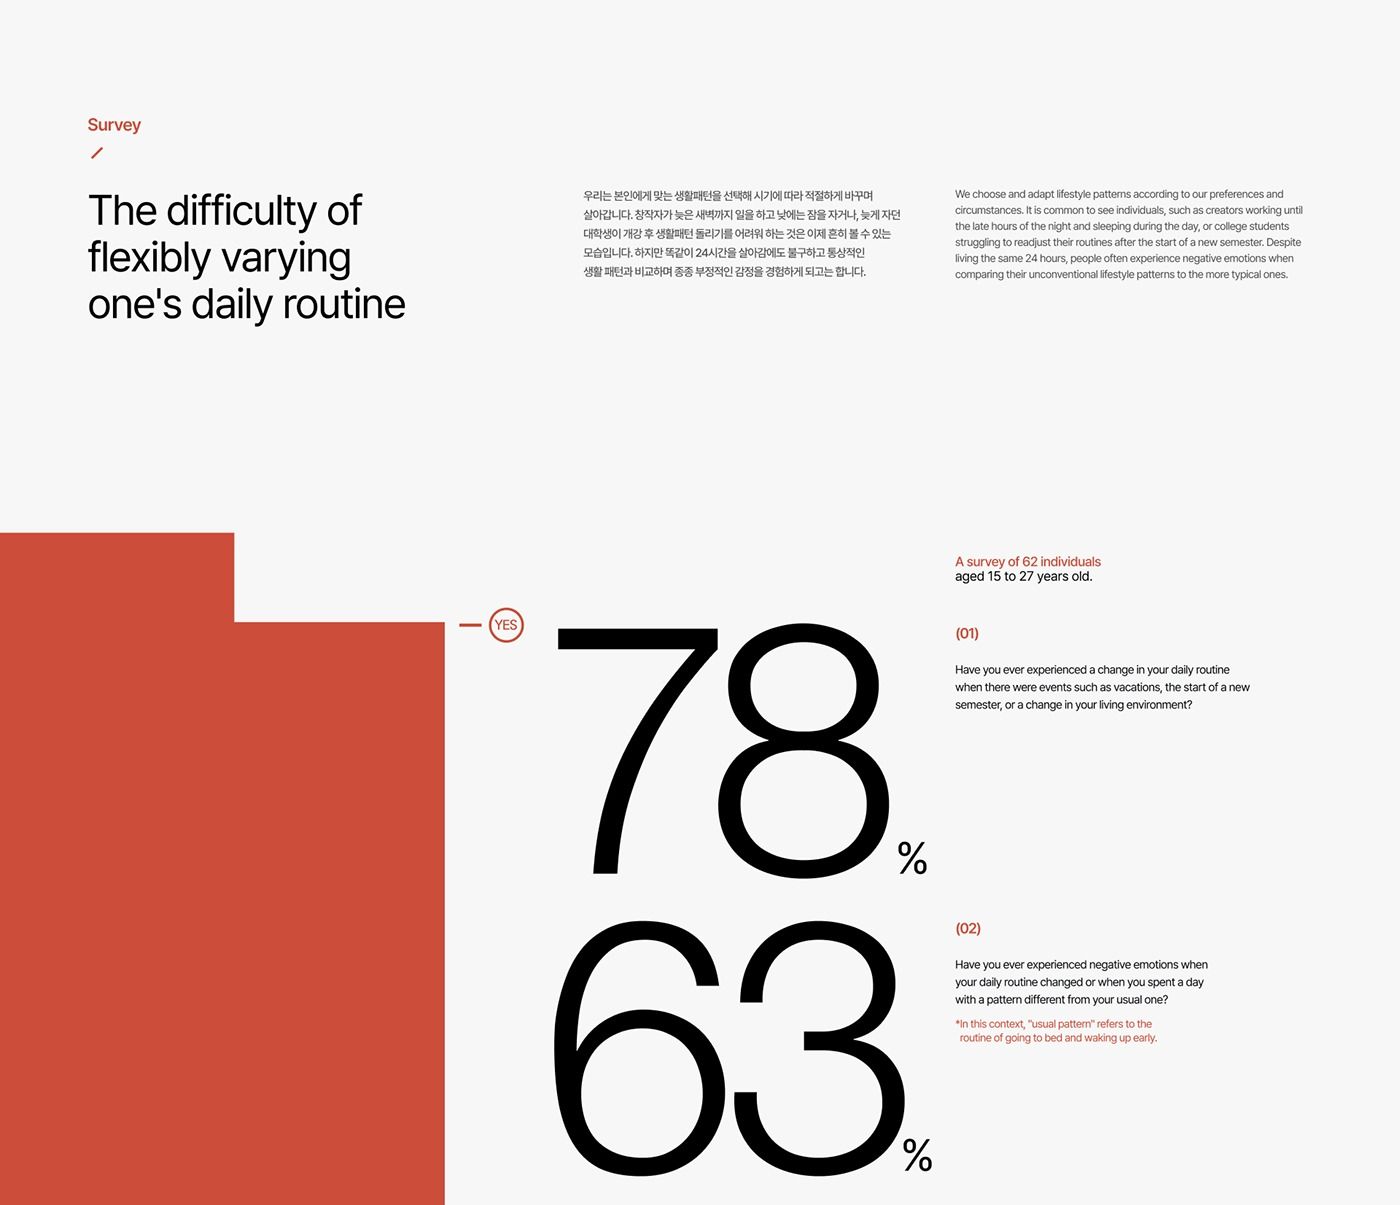
The design is minimalist and clean, utilizing a high-contrast black and white layout with a single accent color (red/terracotta) to present survey results. The visual language is direct and data-focused, prioritizing readability and stark presentation of quantitative information.
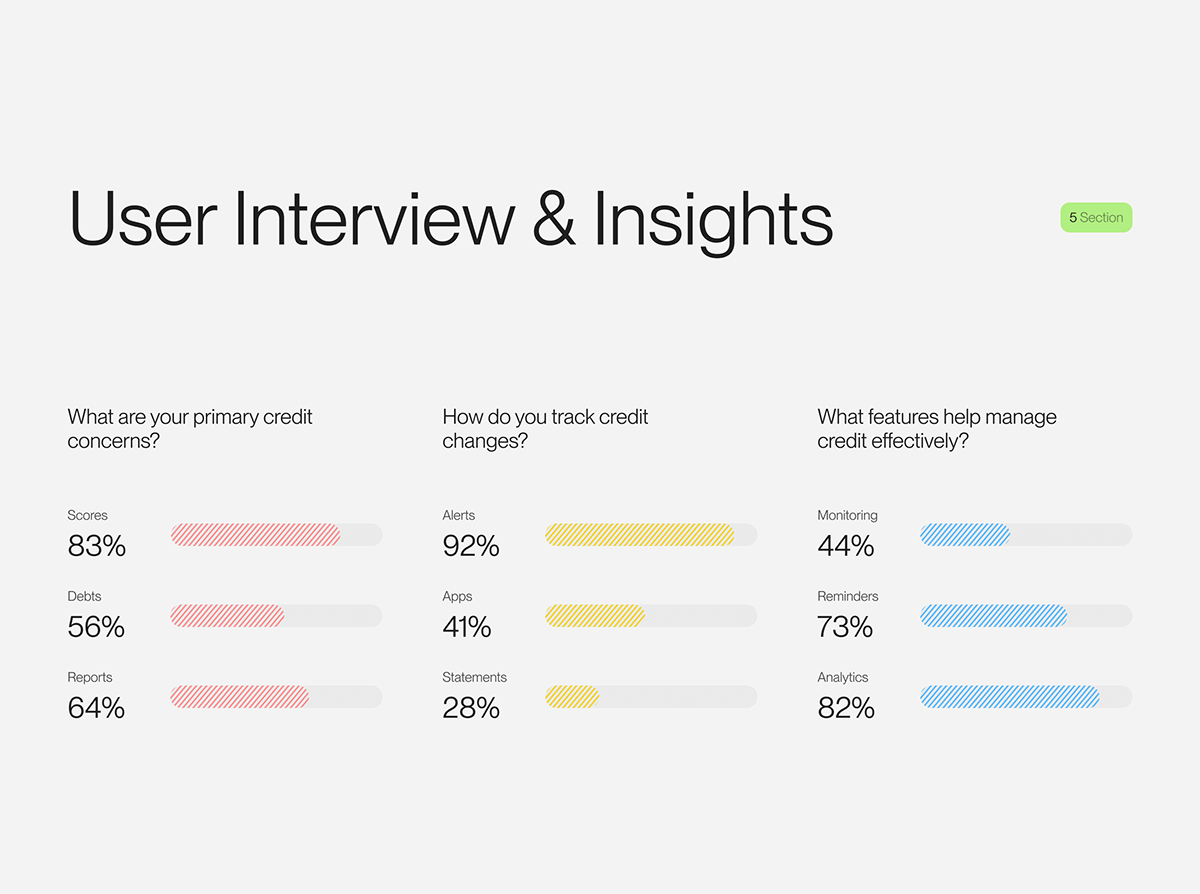
The image presents a clean, minimalist layout typical of a report or presentation slide, using simple horizontal bar charts to display survey results. The design is functional and data-focused, relying heavily on whitespace to separate the various metrics.