technical reporting
2 designs
Showing 2 of 2 (2 total)
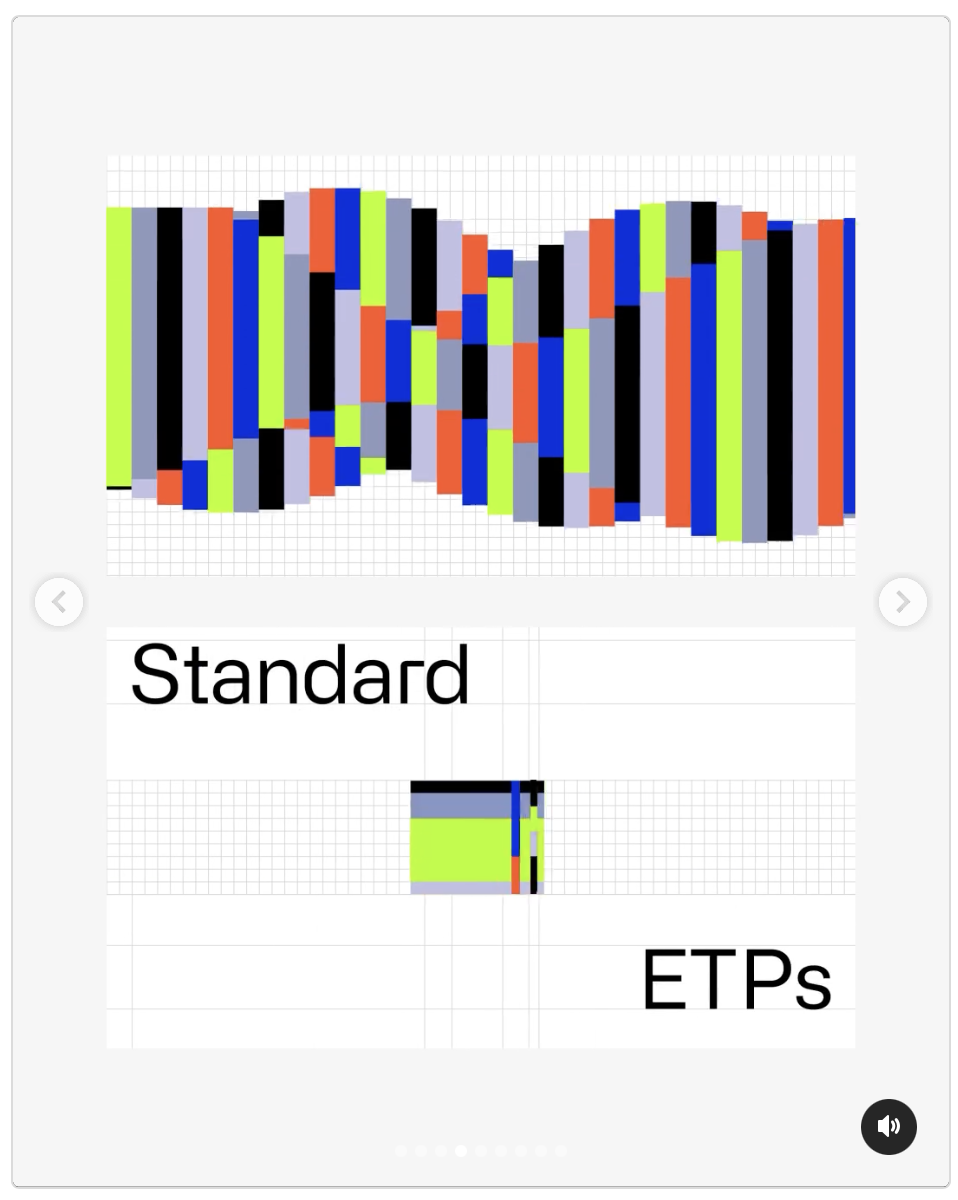
This image presents a clean, technical data visualization comparing two sets of metrics, 'Standard' and 'ETPs,' using a grid-based bar chart format. The design emphasizes clarity and quantitative comparison through distinct color coding and structured layout.
data visualizationtechnicalminimalist
This image utilizes a sharp, technical visual language to present data through segmented vertical bars and contrasting hues. The design emphasizes clarity and precision, employing a cool palette balanced by bursts of warm colors to create visual hierarchy. The overall feel is modern, organized, and deeply analytical.
minimalistdata visualizationhigh contrast