marketing analytics
4 designs
Showing 4 of 4 (4 total)
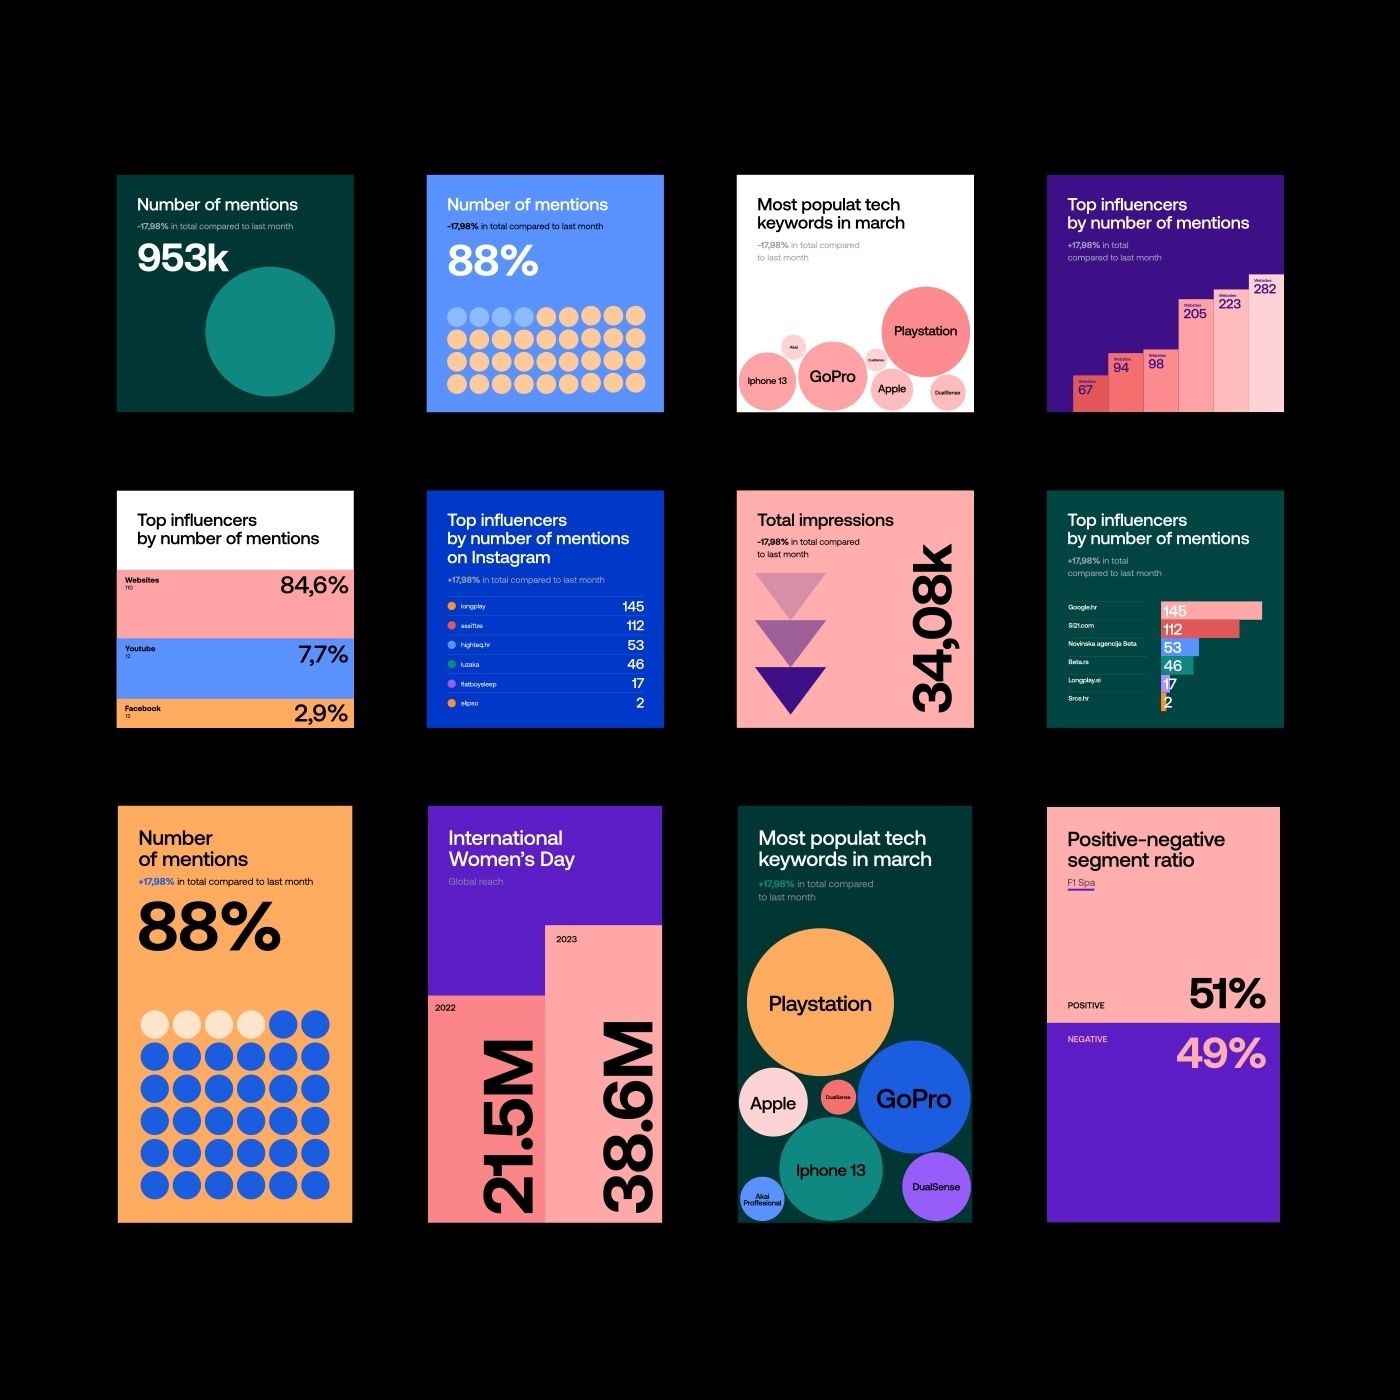
A vibrant collection of data visualization dashboards and infographic cards featuring bold, contrasting color blocks and geometric shapes. The design employs a modern, playful aesthetic with large typography, circular elements, and stacked bar charts to communicate statistical information. The overall visual language is contemporary and tech-forward, emphasizing clarity and visual impact through color-coding and minimalist composition.
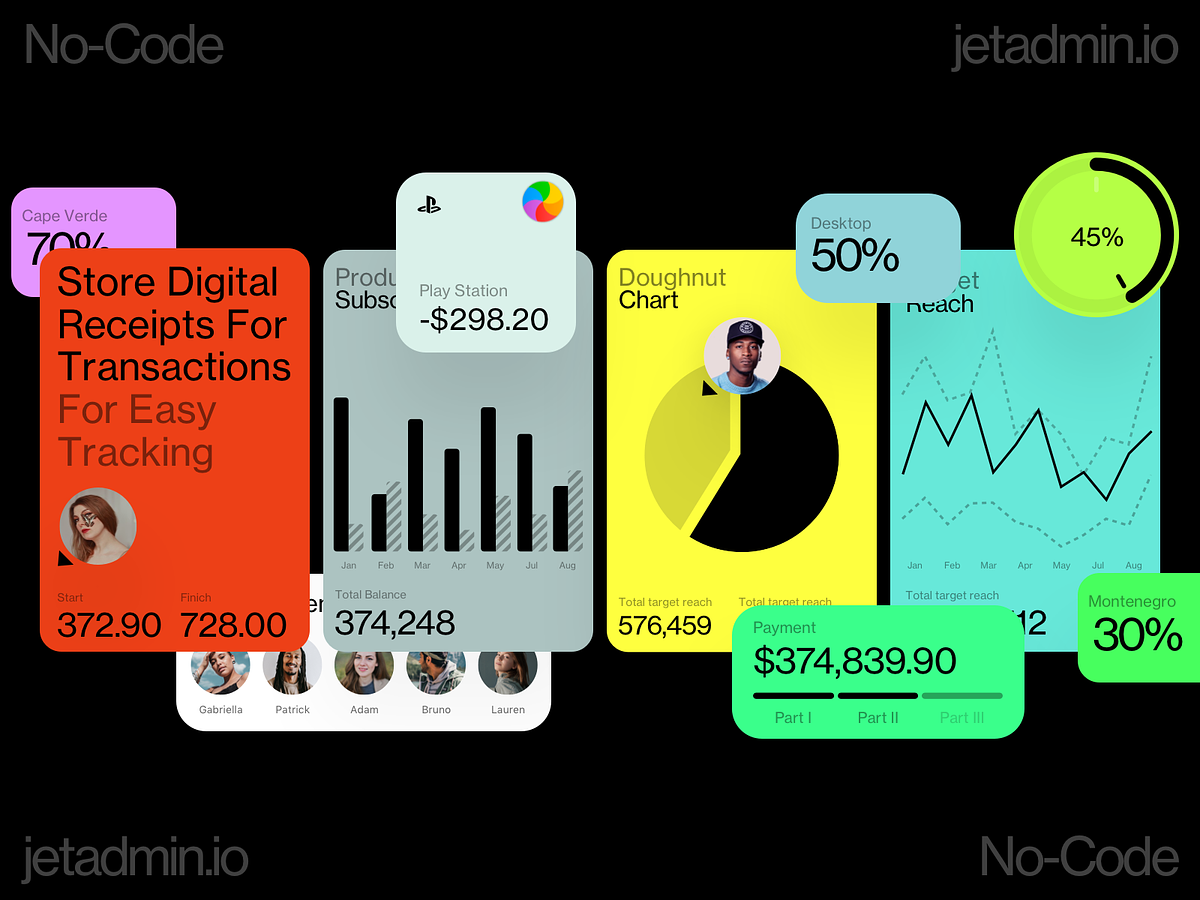
This dashboard employs a modern, clean flat design aesthetic focused heavily on data visualization. The visual language is professional and analytical, using vibrant colors and clear segmentation to present complex numerical data effectively. The overall feel is organized, dynamic, and tech-focused.
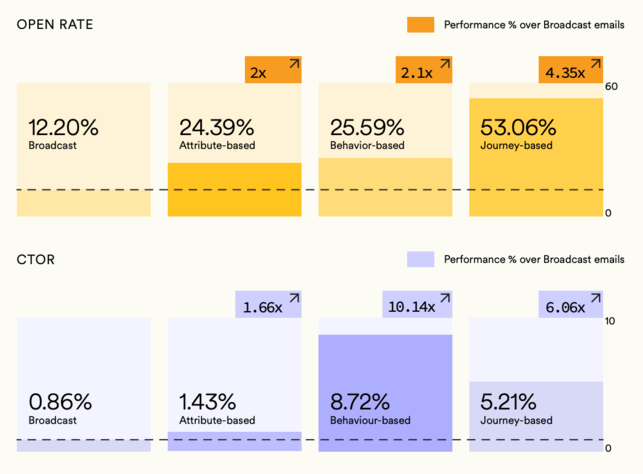
This visualization employs a clean, modular design using horizontal segmented bars to compare performance metrics across different methodologies (e.g., attribute-based vs. journey-based). The visual language is highly structured, relying on color saturation and clear labeling to facilitate rapid comparison of quantitative data.
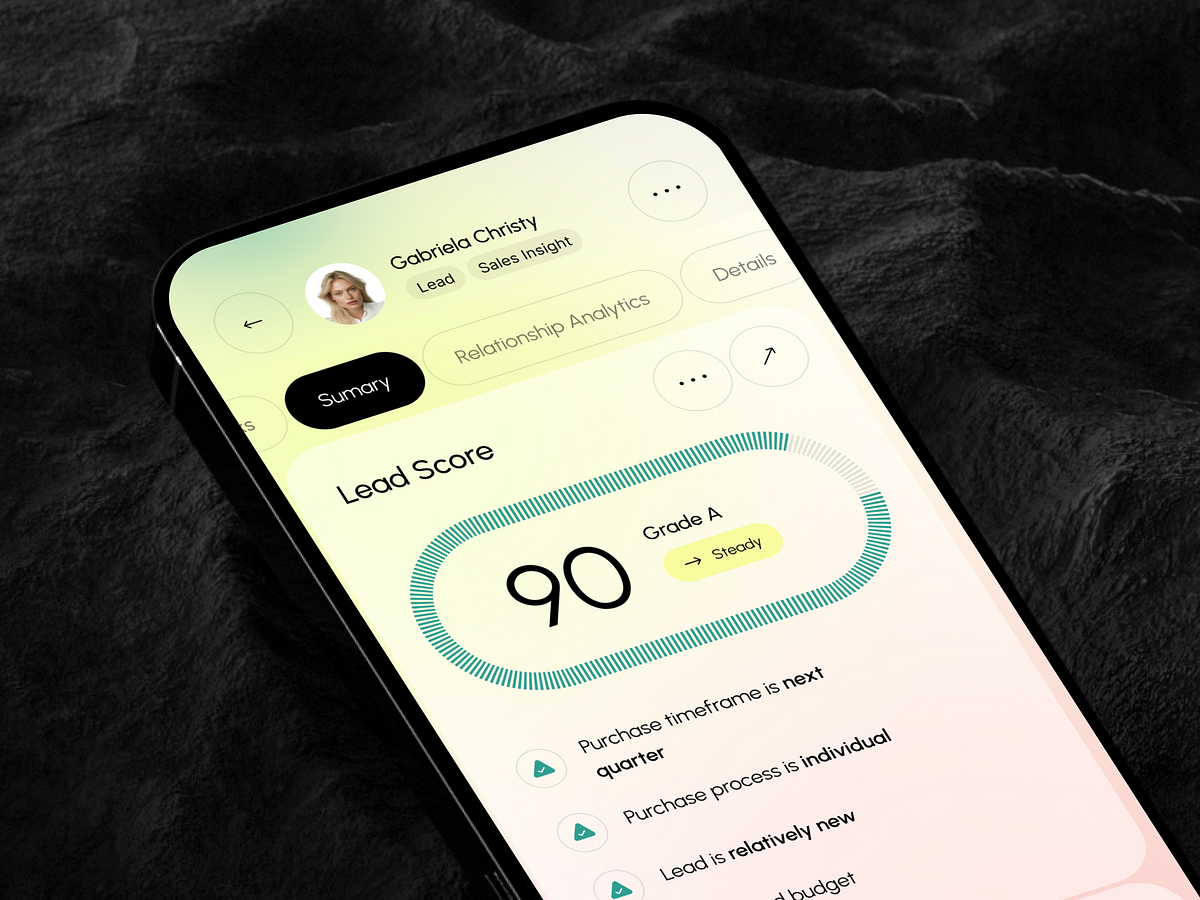
This screen features a clean, modern user interface designed for presenting analytical data clearly. The design utilizes subtle color accents and ample whitespace to ensure readability and establish a professional, trustworthy feel. It effectively balances complex metrics into an easily digestible visual format.