1 designs
Showing 1 of 1 (1 total)
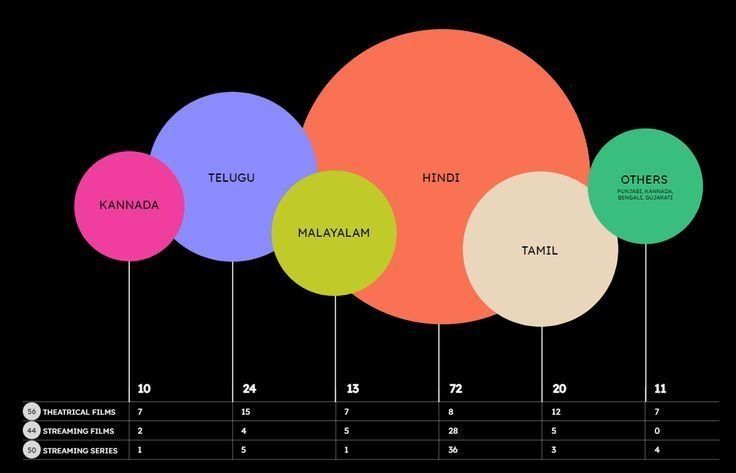
The image is a data visualization, likely a chart or infographic, using a circular/pie-like representation to display counts across different language categories. The design is clean, uses a limited palette of warm and cool tones, and relies on clear segmentation to present quantitative information.