consumer behavior
4 designs
Showing 4 of 4 (4 total)
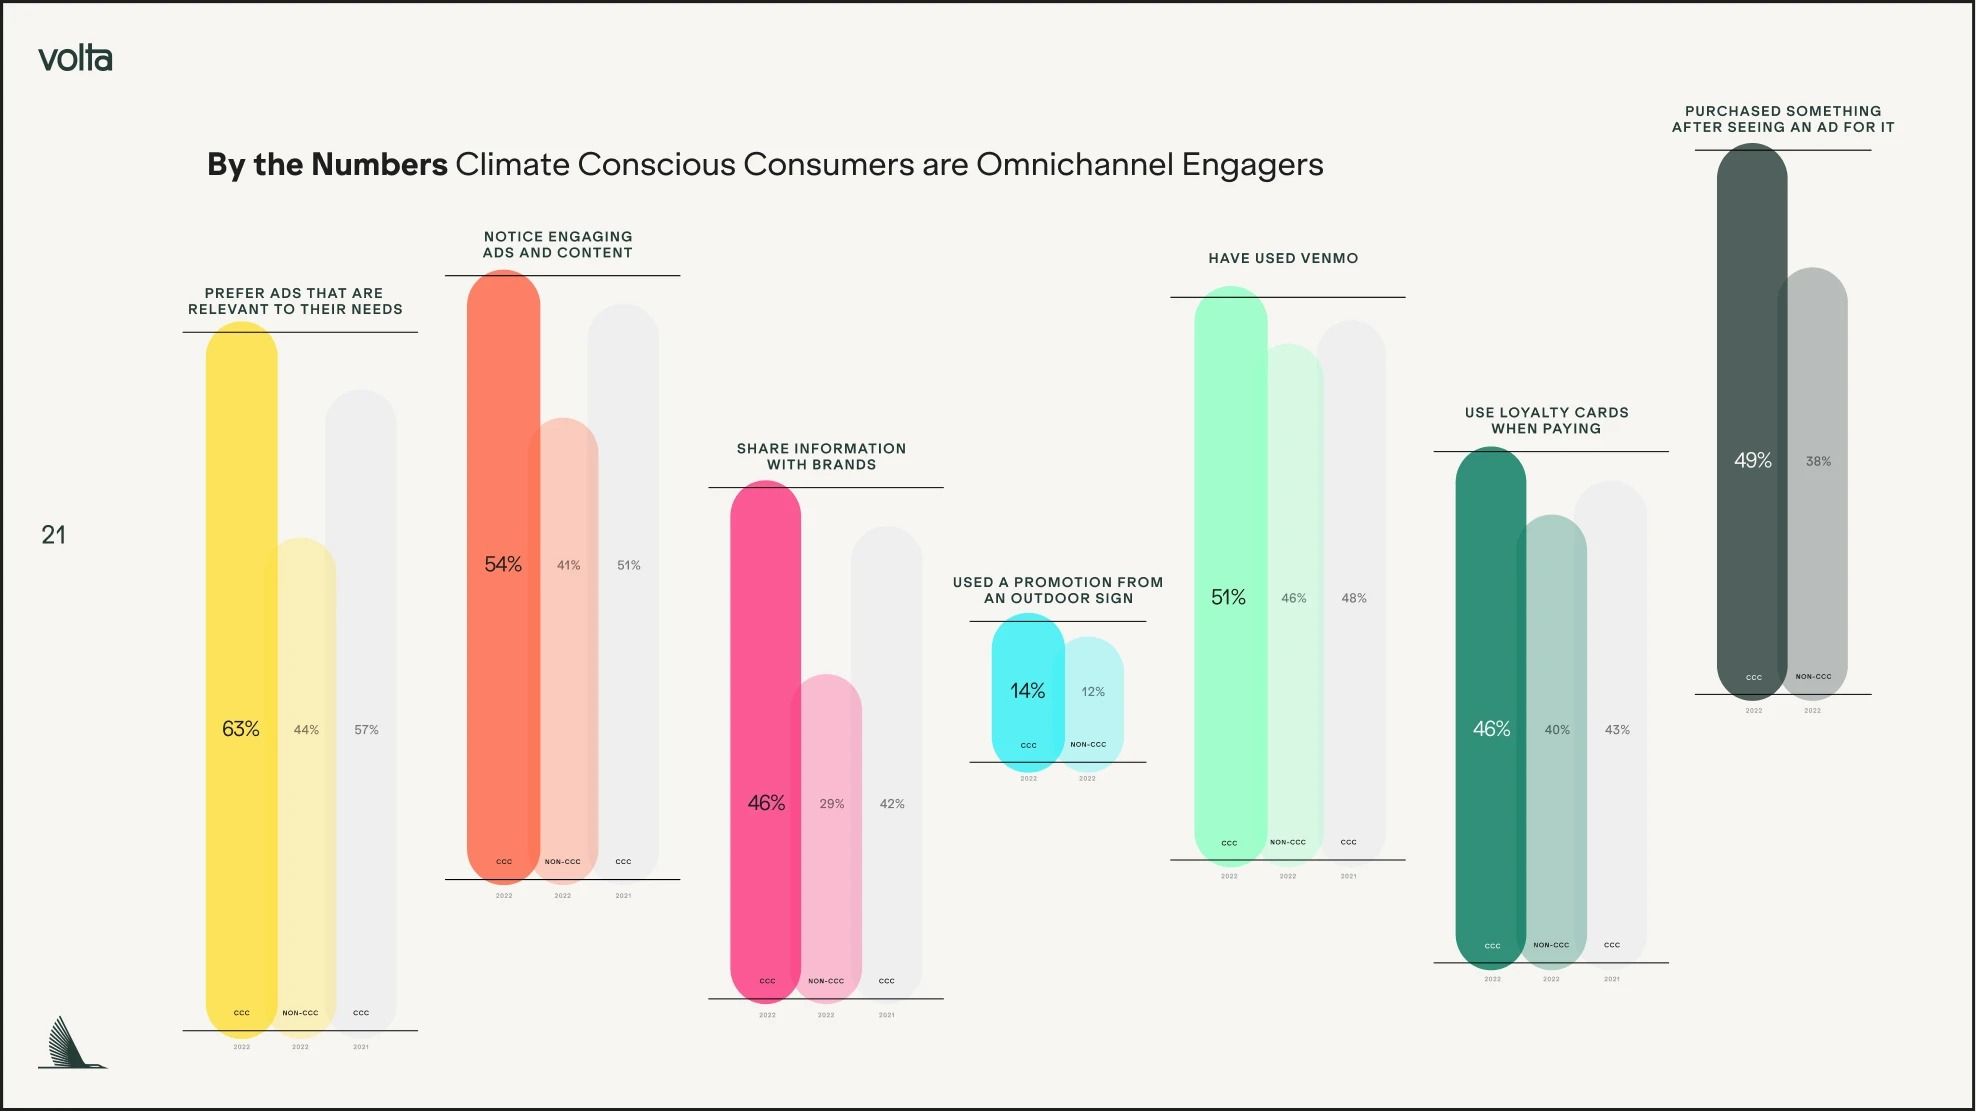
This is a data visualization infographic presenting consumer engagement metrics, utilizing a clean, modern, and professional aesthetic. The design relies heavily on vertical bar charts and clear labeling to convey quantitative information effectively.
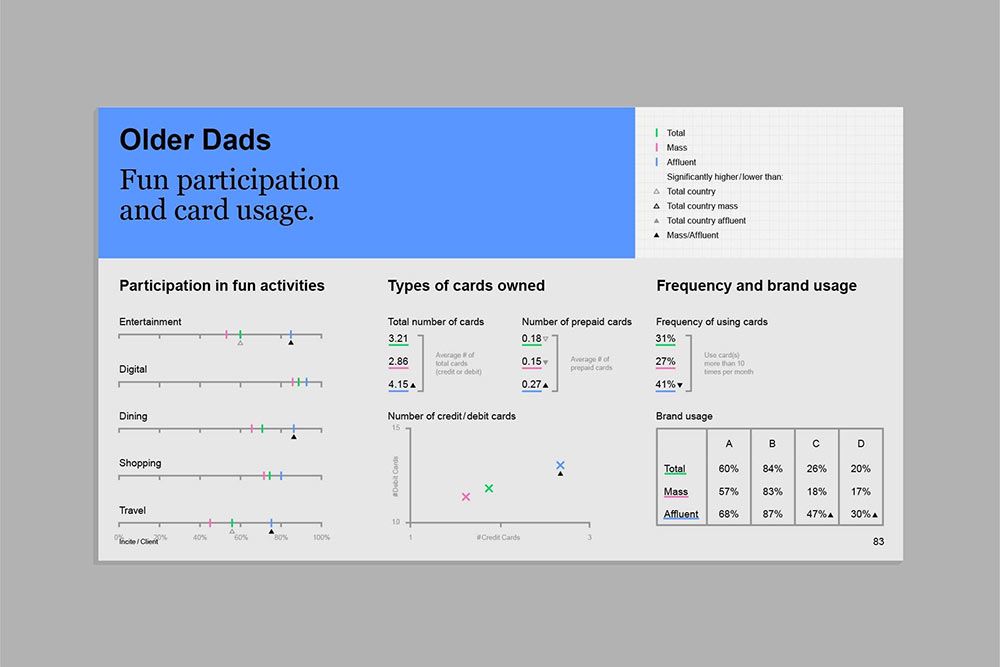
This design employs a clean, functional data visualization style suitable for reporting. It effectively uses horizontal bar charts and clear statistical markers to compare participation levels across various categories, resulting in an objective and analytical feel.
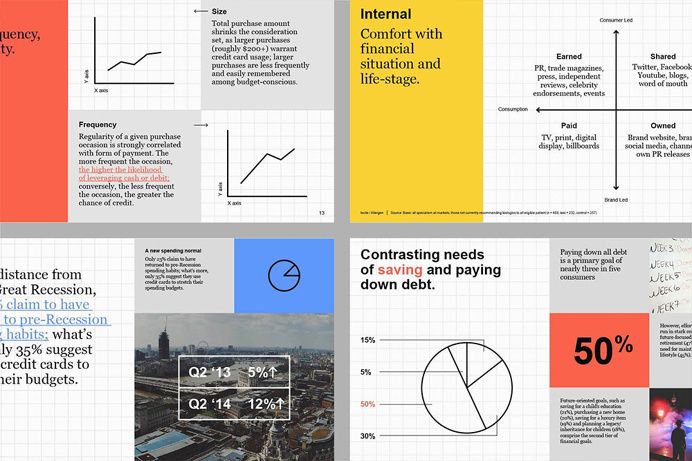
This is a highly structured infographic presentation using clean data visualizations to illustrate complex consumer finance and spending behaviors. The design utilizes a grid system to present multiple statistical trends clearly, prioritizing information density and analytical clarity.
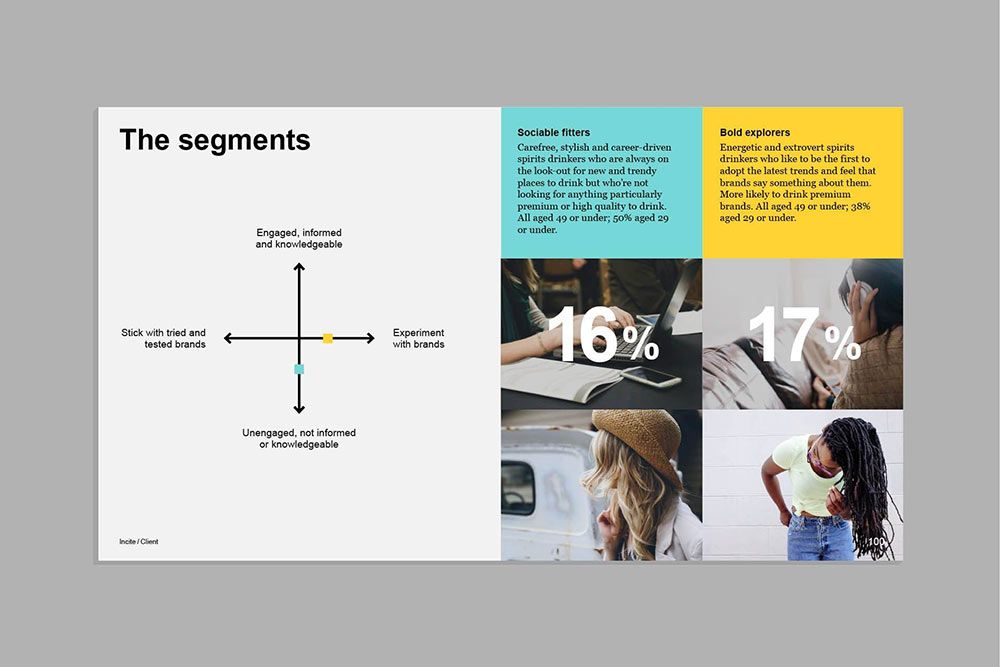
This is a clear and functional data visualization designed to segment consumers based on their engagement level with brands. The design uses a clean, diagrammatic approach to categorize market segments, utilizing both textual labels and illustrative photography to convey consumer profiles effectively.