business reporting
8 designs
Showing 8 of 8 (8 total)
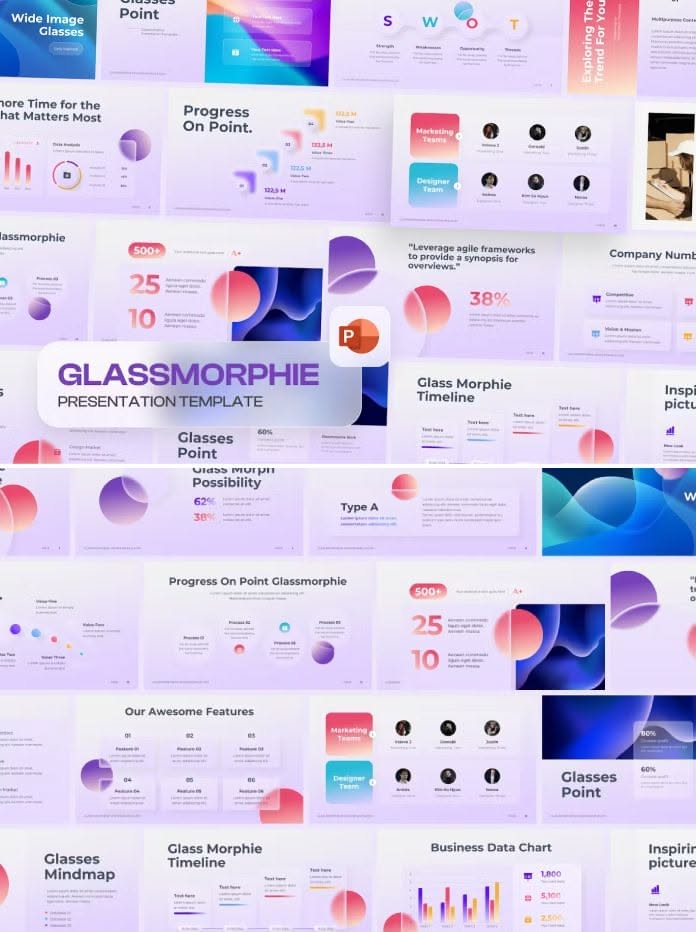
This image presents a dense collection of modern presentation templates characterized by soft color gradients and geometric data visualizations. The visual language is clean and modular, designed to facilitate easy data storytelling in a corporate context. The overall feel is professional, contemporary, and inviting.
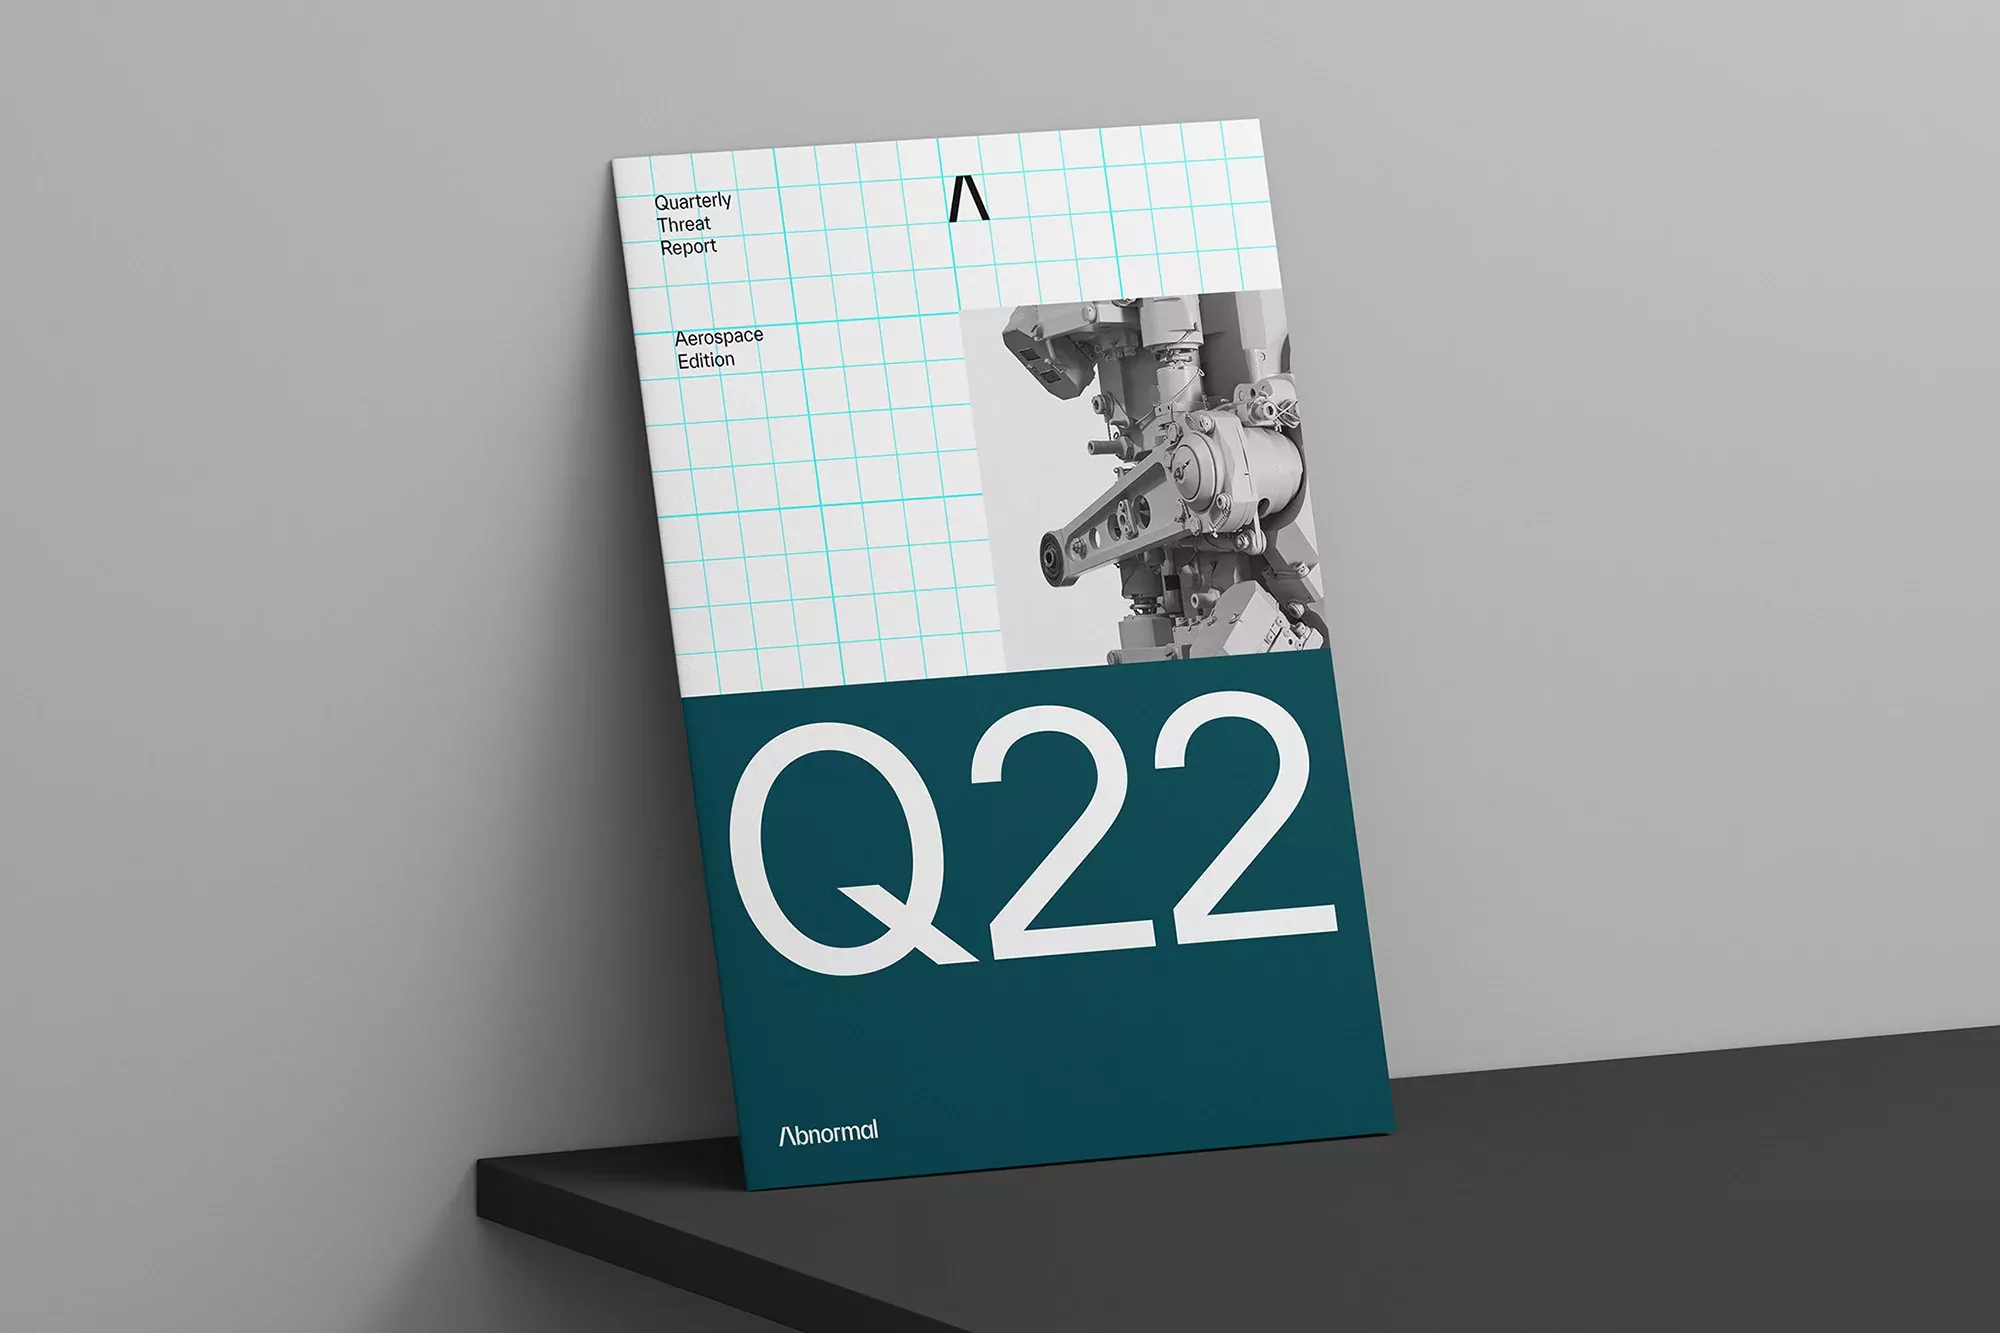
A minimalist quarterly report cover featuring a clean grid-based layout with a striking teal color block. The design combines professional typography with a black and white architectural photograph, creating a contemporary corporate aesthetic that balances information hierarchy with visual sophistication.
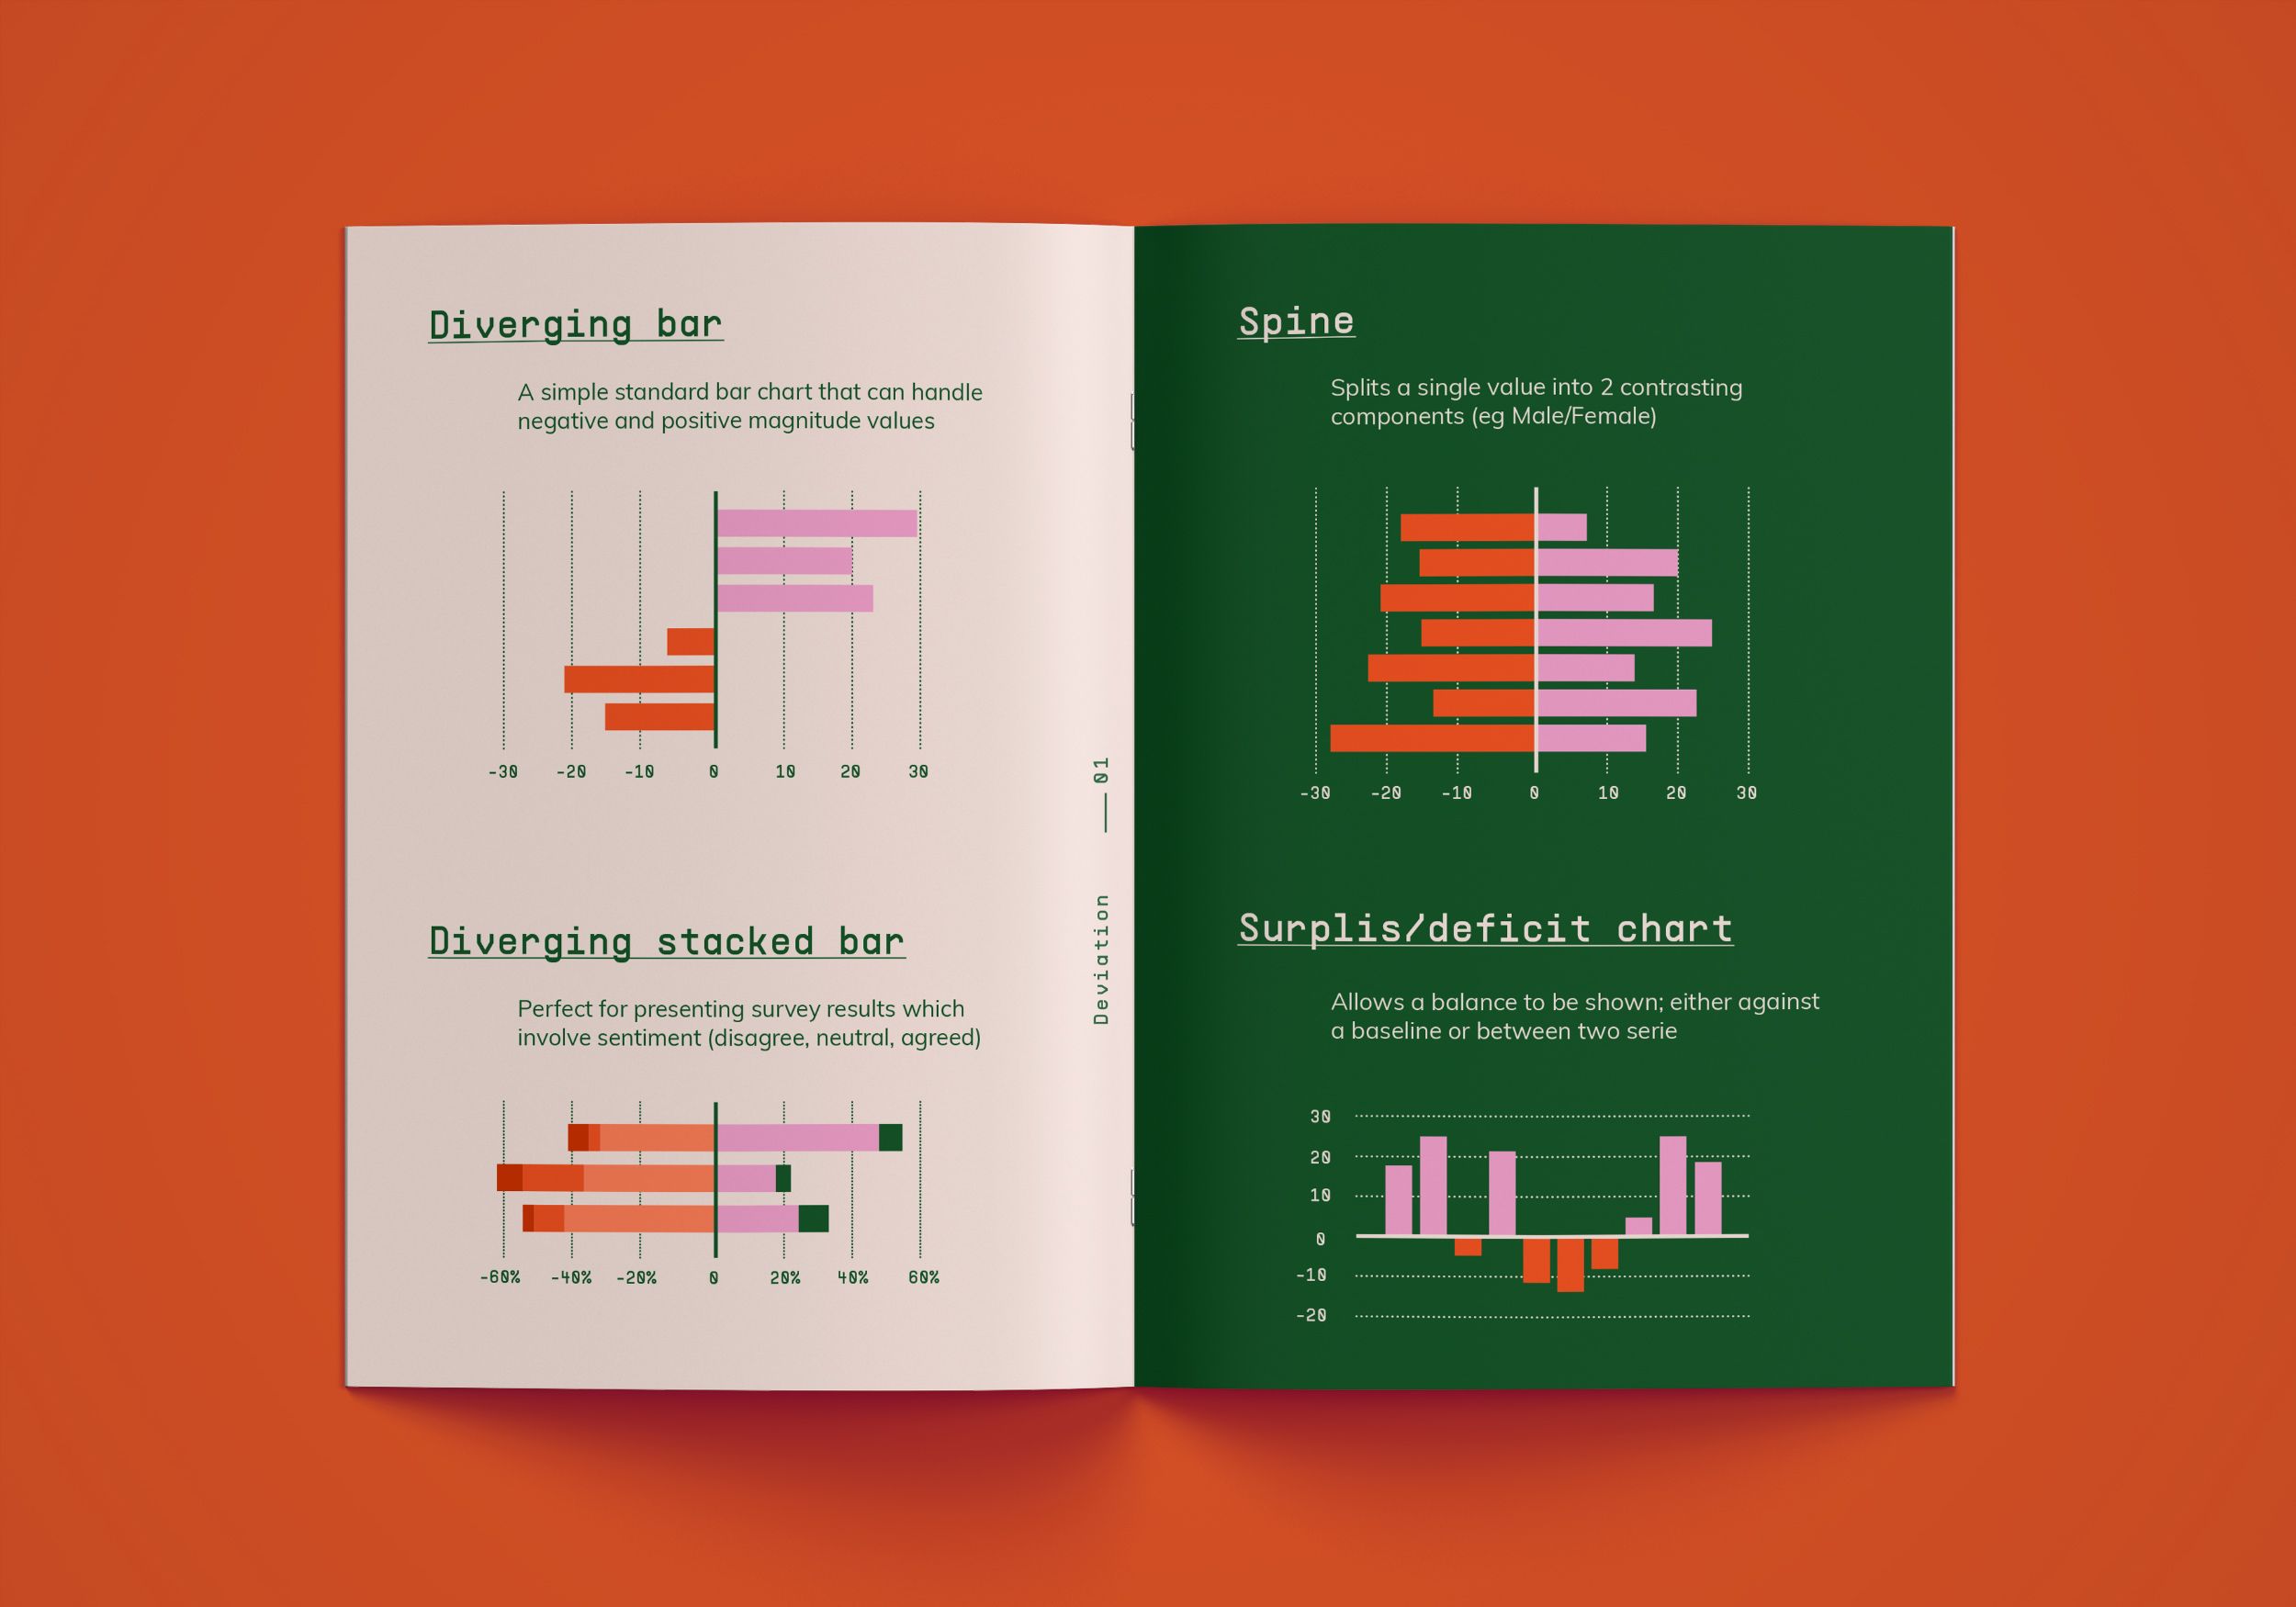
The image displays a clean, professional presentation of statistical data using bar charts on a warm orange background. The design emphasizes clarity and direct comparison through simple, high-contrast graphical elements.
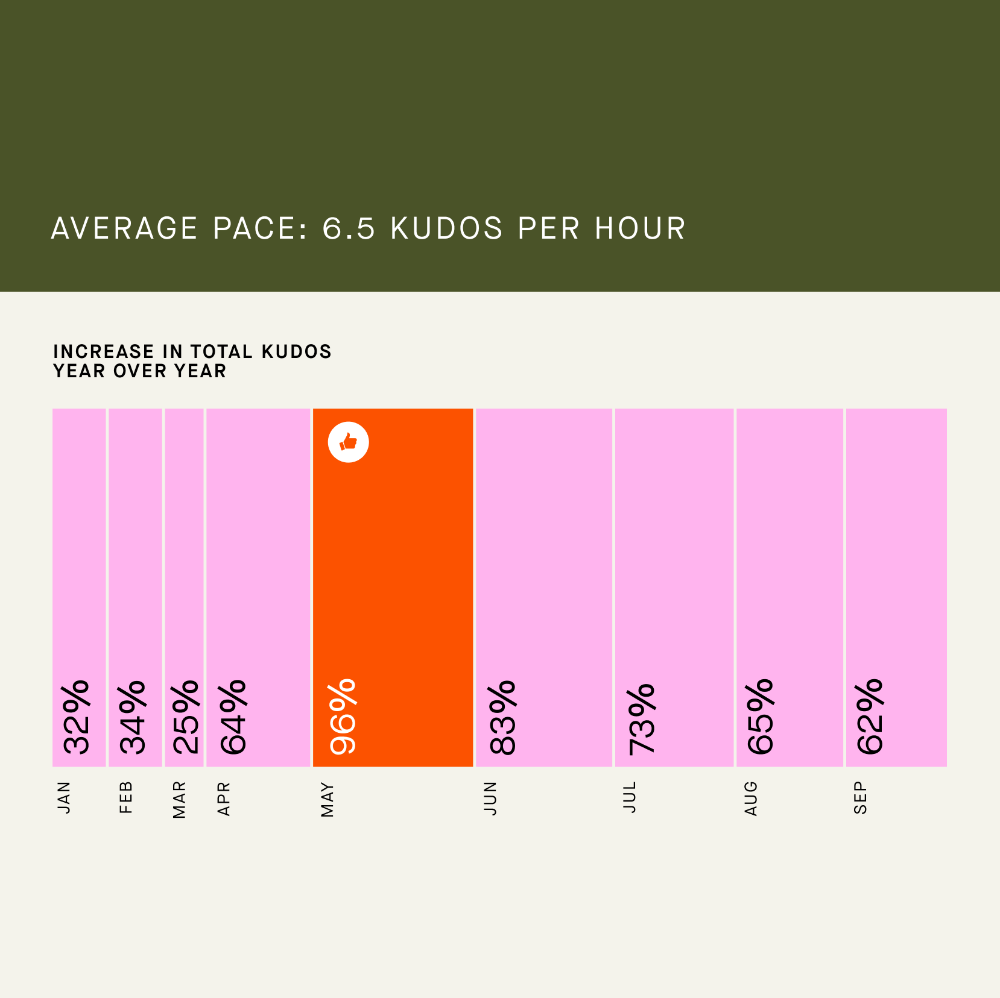
The design is clean, minimalist, and uses a simple bar chart visualization to present year-over-year growth data. The use of soft pinks and a strong orange accent against a muted olive green background creates a professional yet approachable feel.
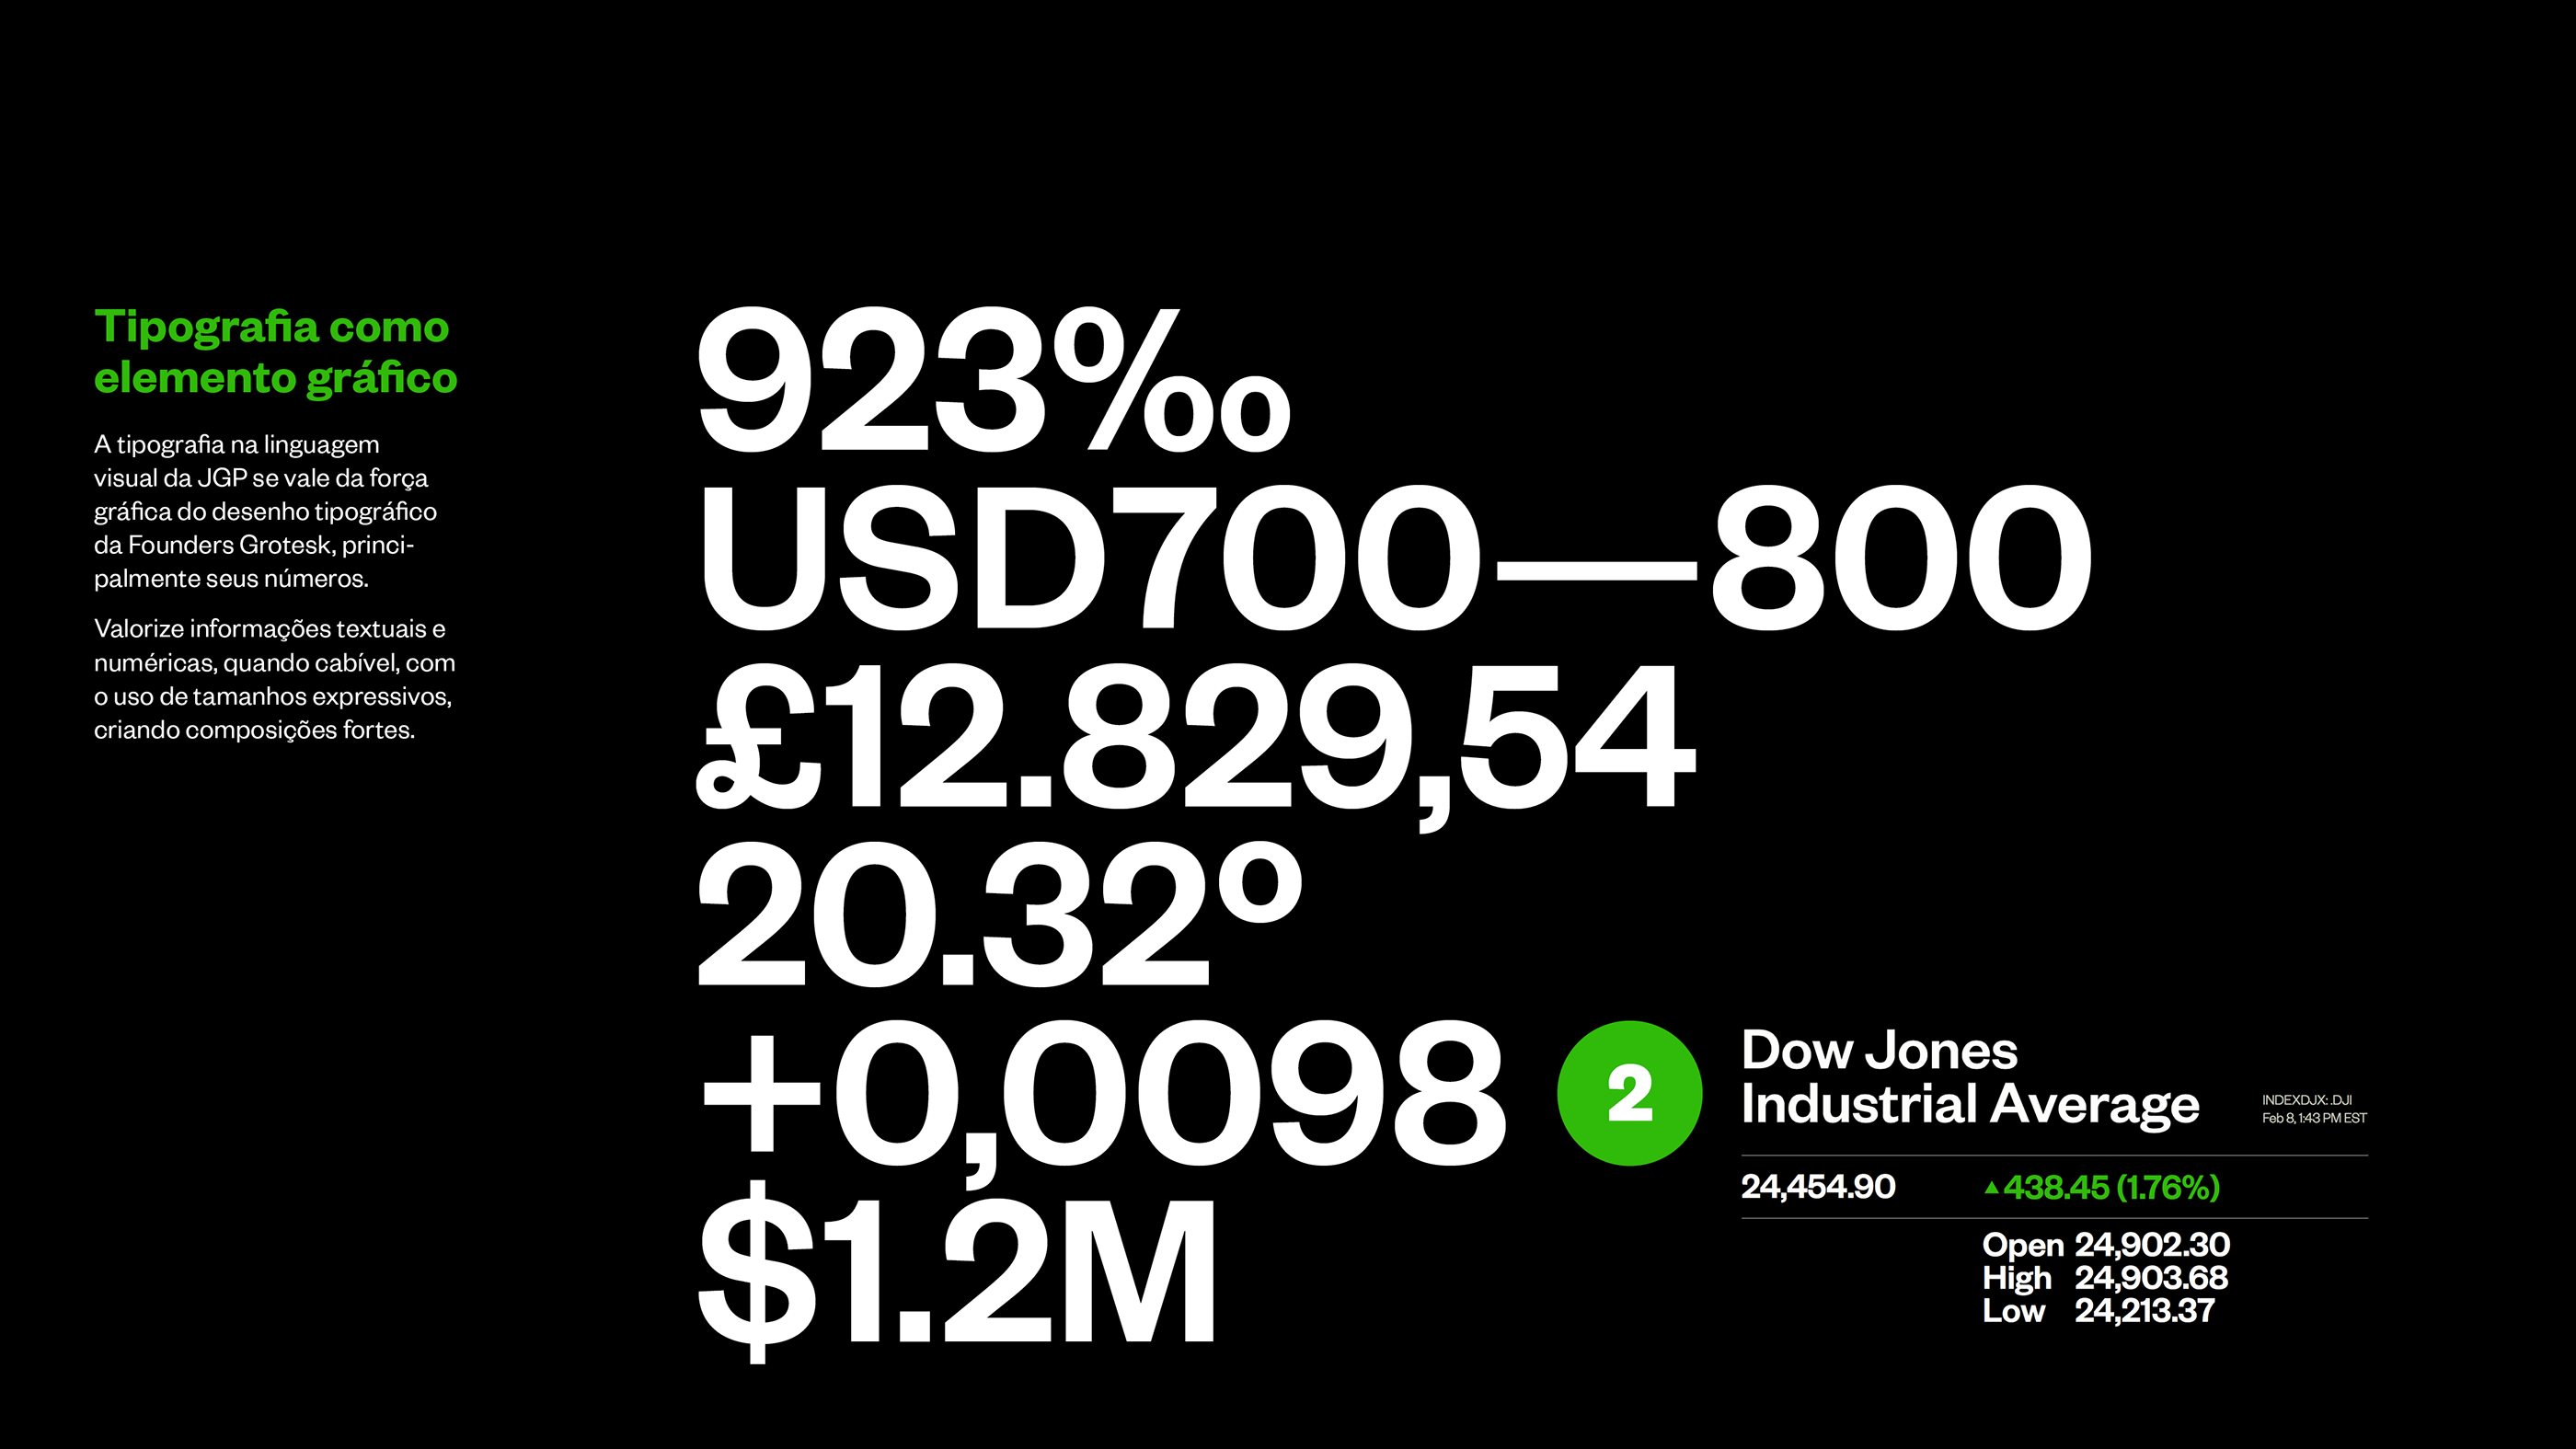
This graphic utilizes a stark, high-contrast minimalist design to present quantitative data with maximum visual impact. The layout is clean and focused, relying purely on typography and numerical hierarchy to convey complex financial statistics efficiently. The overall feel is professional, analytical, and assertive.
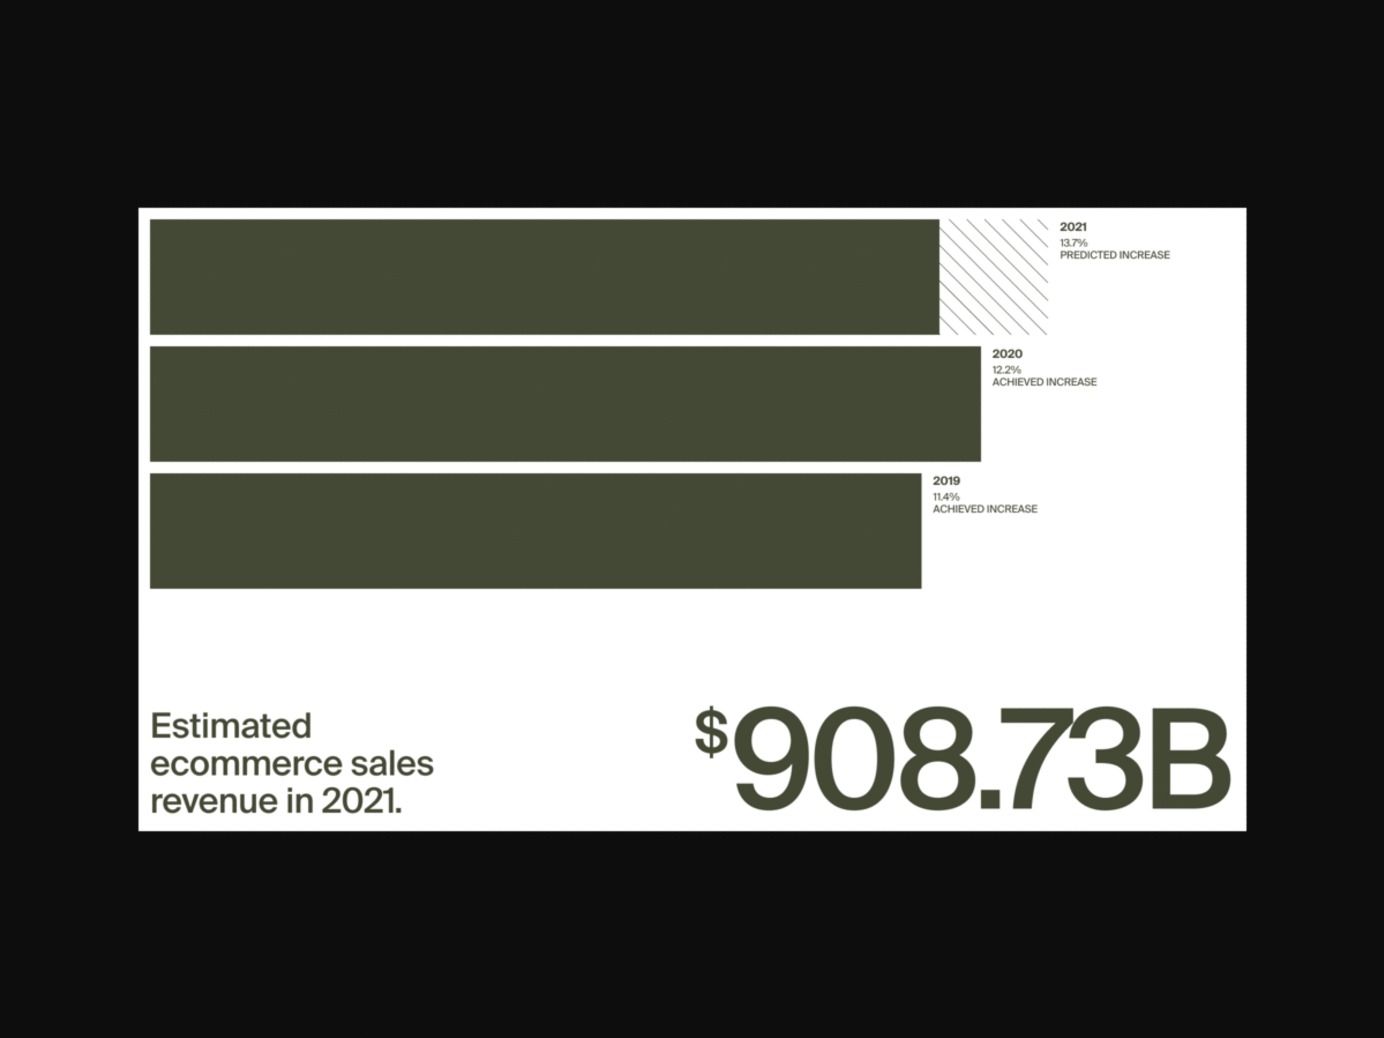
This is a stark, high-contrast data visualization using a dark theme to present historical growth metrics and projected financial figures. The design emphasizes clarity and professionalism through clean lines and a restricted, sophisticated color palette.
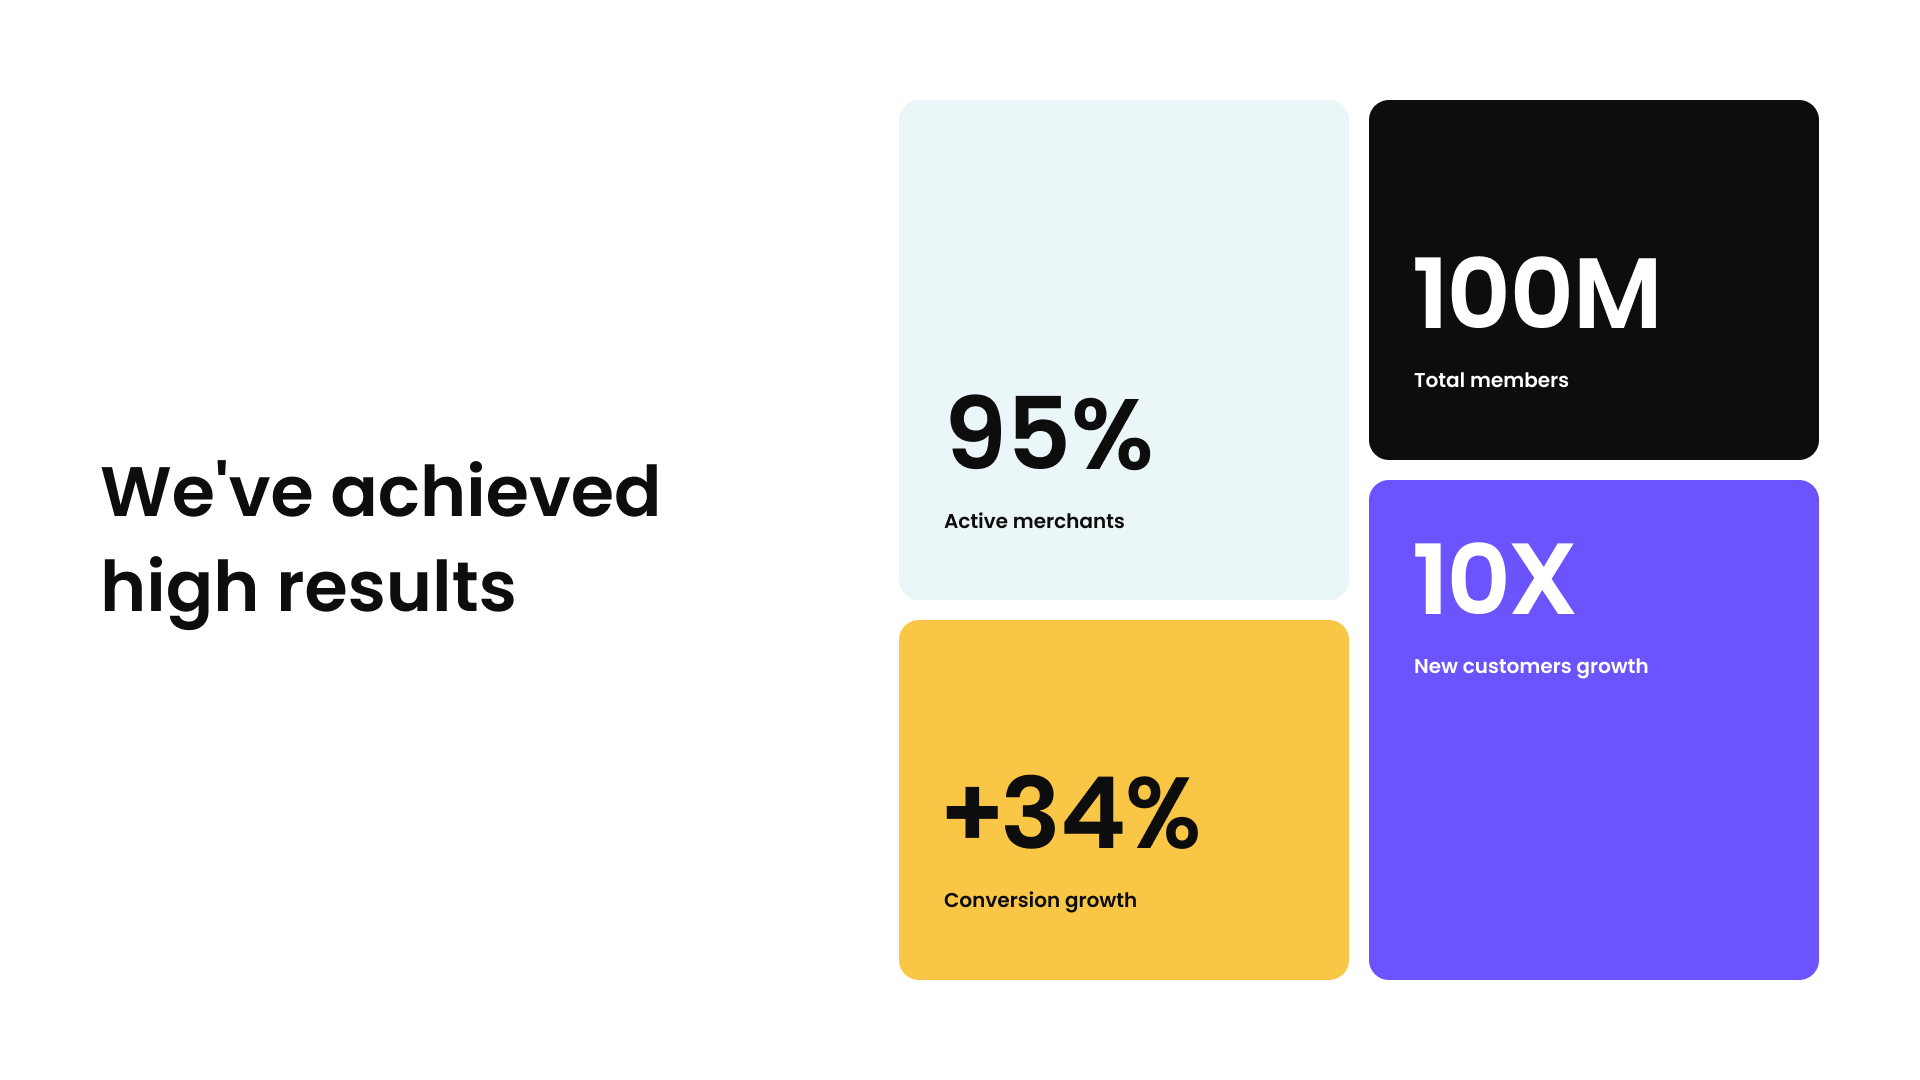
This is a clean, professional data visualization designed to showcase significant business achievements. The design utilizes a minimalist aesthetic with strong color blocking and clear typography to quickly communicate key performance indicators (KPIs) in a highly digestible format.
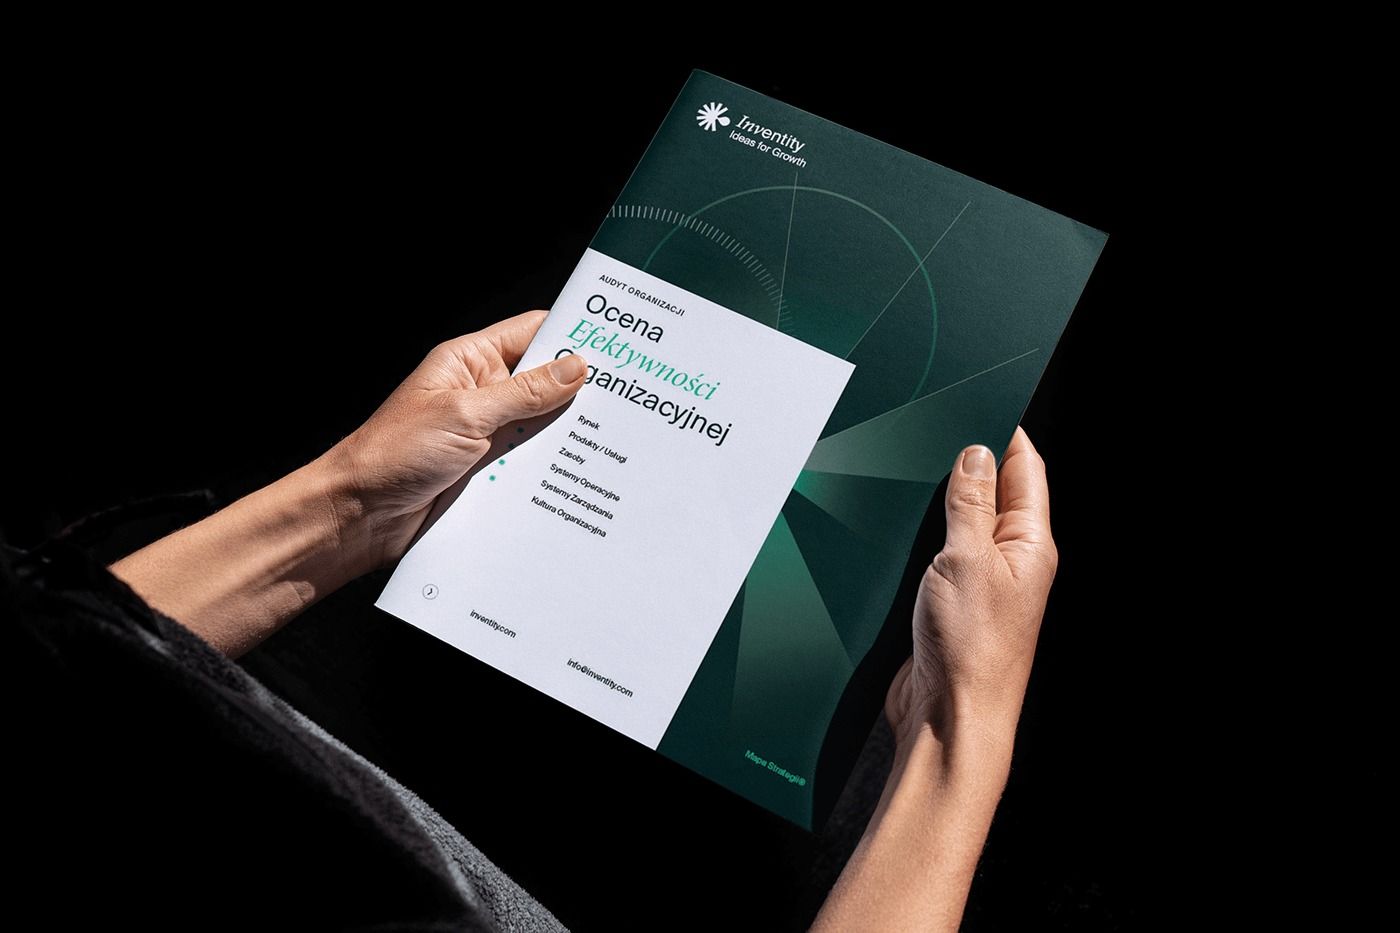
This image utilizes high contrast and dramatic lighting to showcase a professional report or assessment, emphasizing trust and expertise. The visual language is clean and corporate, leveraging deep greens and shadows to convey sophistication and serious analysis.