UX/UI design
36 designs
Showing 24 of 36 (36 total)
This design uses a stark, minimalist visual language to present a clear binary choice between an affirmative action and a negative prohibition. The use of simple line art combined with universally recognized symbols (check mark and X) creates immediate, unambiguous communication.
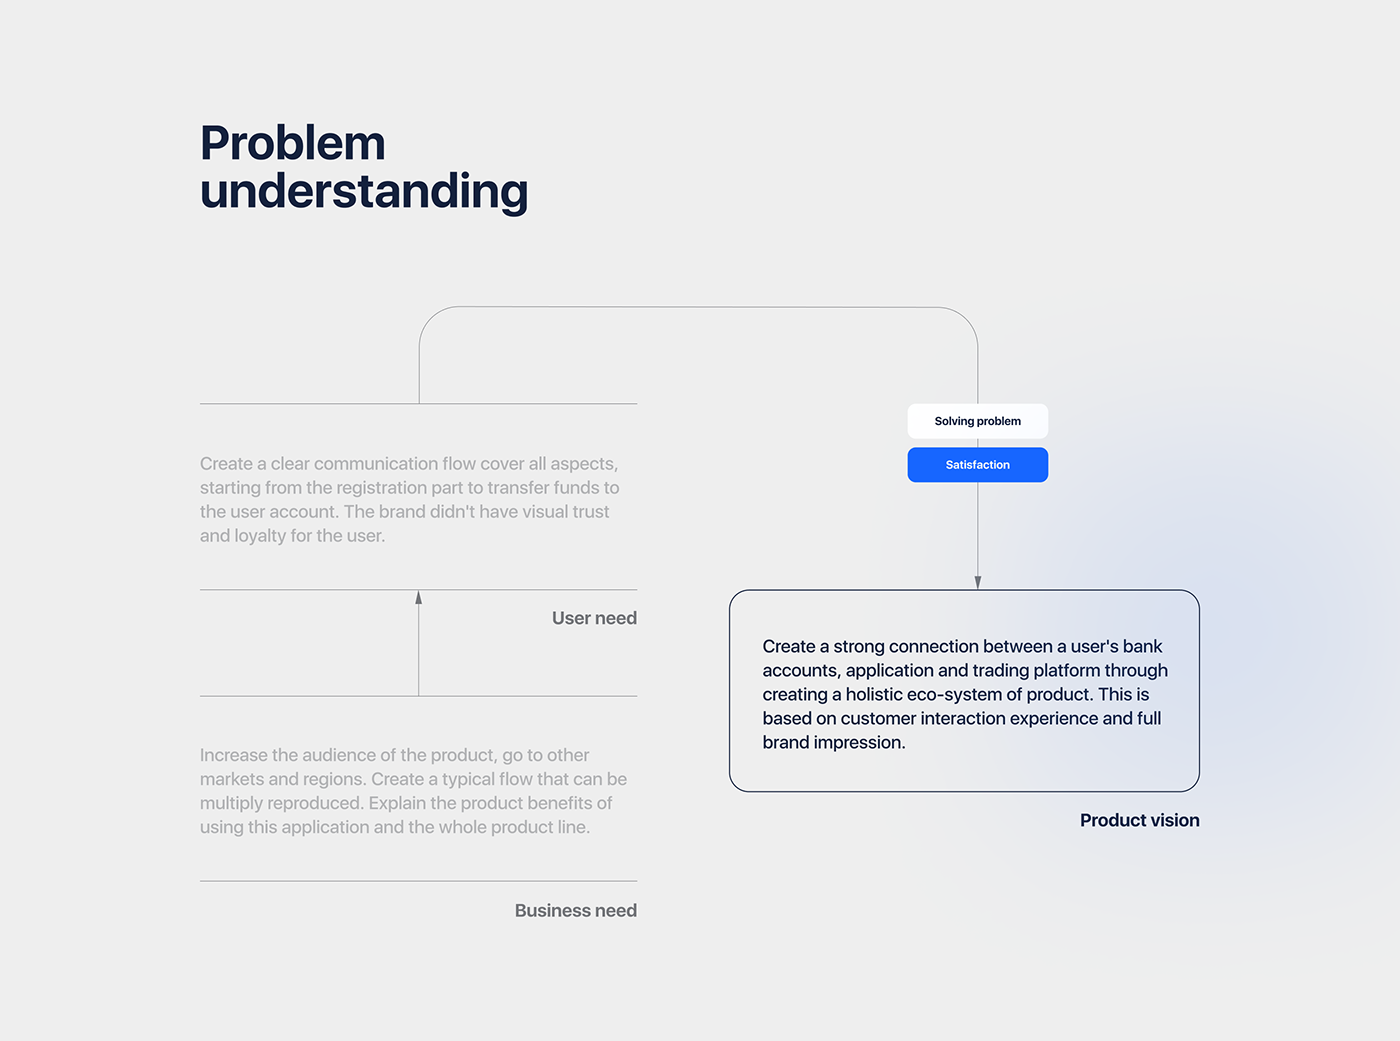
This is a clean, minimalist conceptual diagram illustrating the flow from problem understanding to product vision. The design uses simple lines and distinct text blocks to map out relationships between user needs, business needs, and the final product vision.
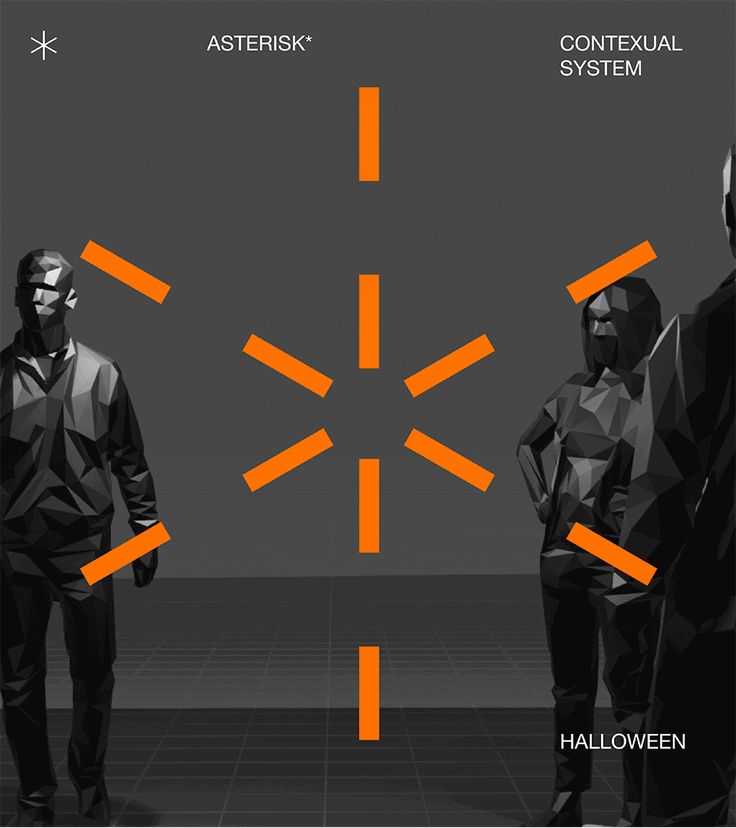
This image utilizes a stark, geometric visual language to present a conceptual diagram, featuring stylized human silhouettes and radiating lines. The design relies heavily on high contrast between dark tones and vibrant orange accents to create a modern, clinical, yet slightly eerie atmosphere. It effectively communicates complex systems or relationships through clear, symmetrical spatial organization.
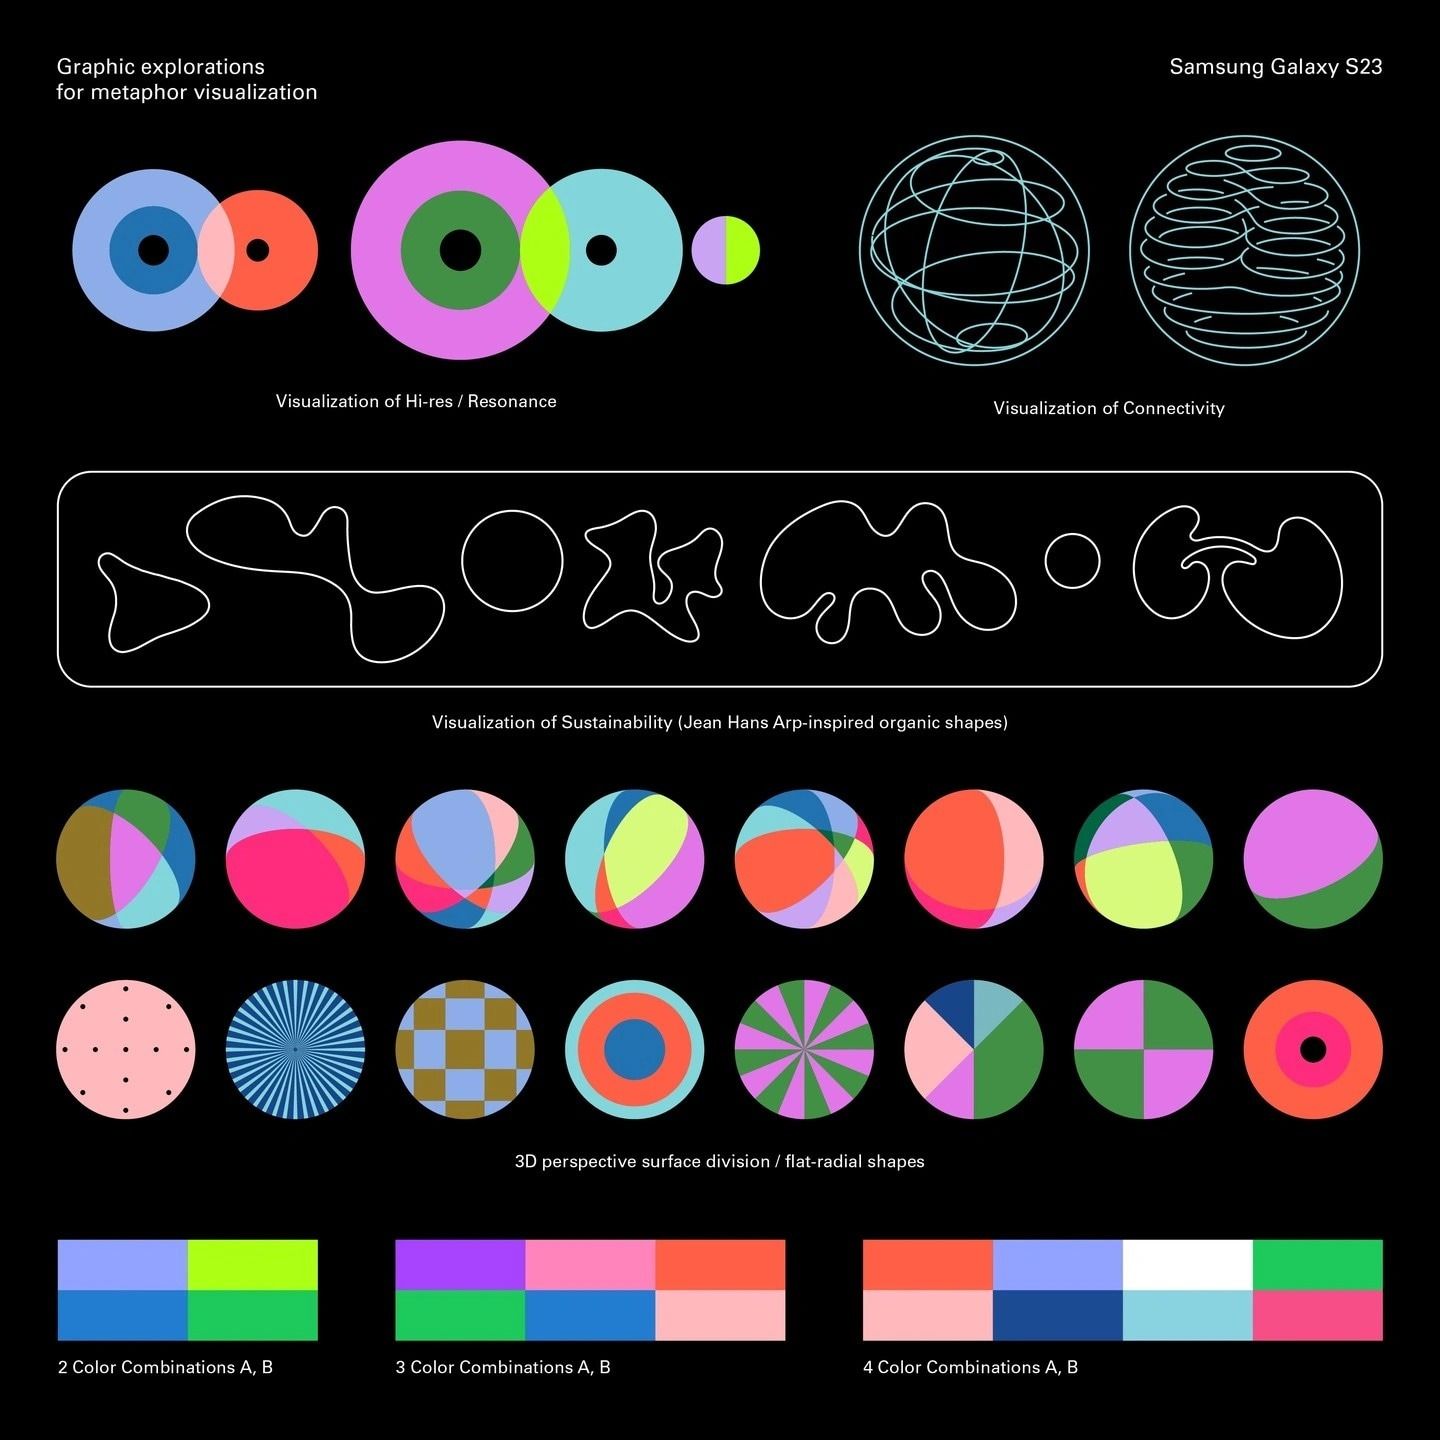
This image presents a curated collection of abstract graphic explorations, demonstrating various ways to visualize concepts like resonance, connectivity, and sustainability. The work balances fluid, organic line drawings with structured, colorful geometric shapes to explore complex data metaphors.
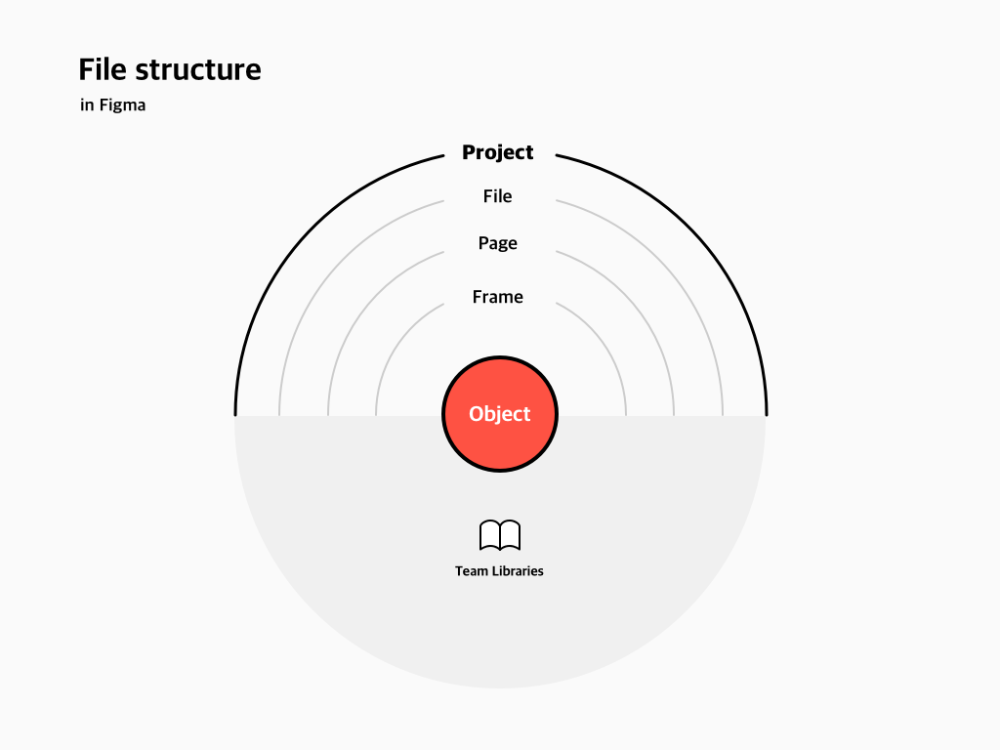
This is a clean, minimalist diagram illustrating a hierarchical file structure within a design tool like Figma. The visual language relies on simple concentric circles and clear labeling to convey complex organizational relationships effectively.
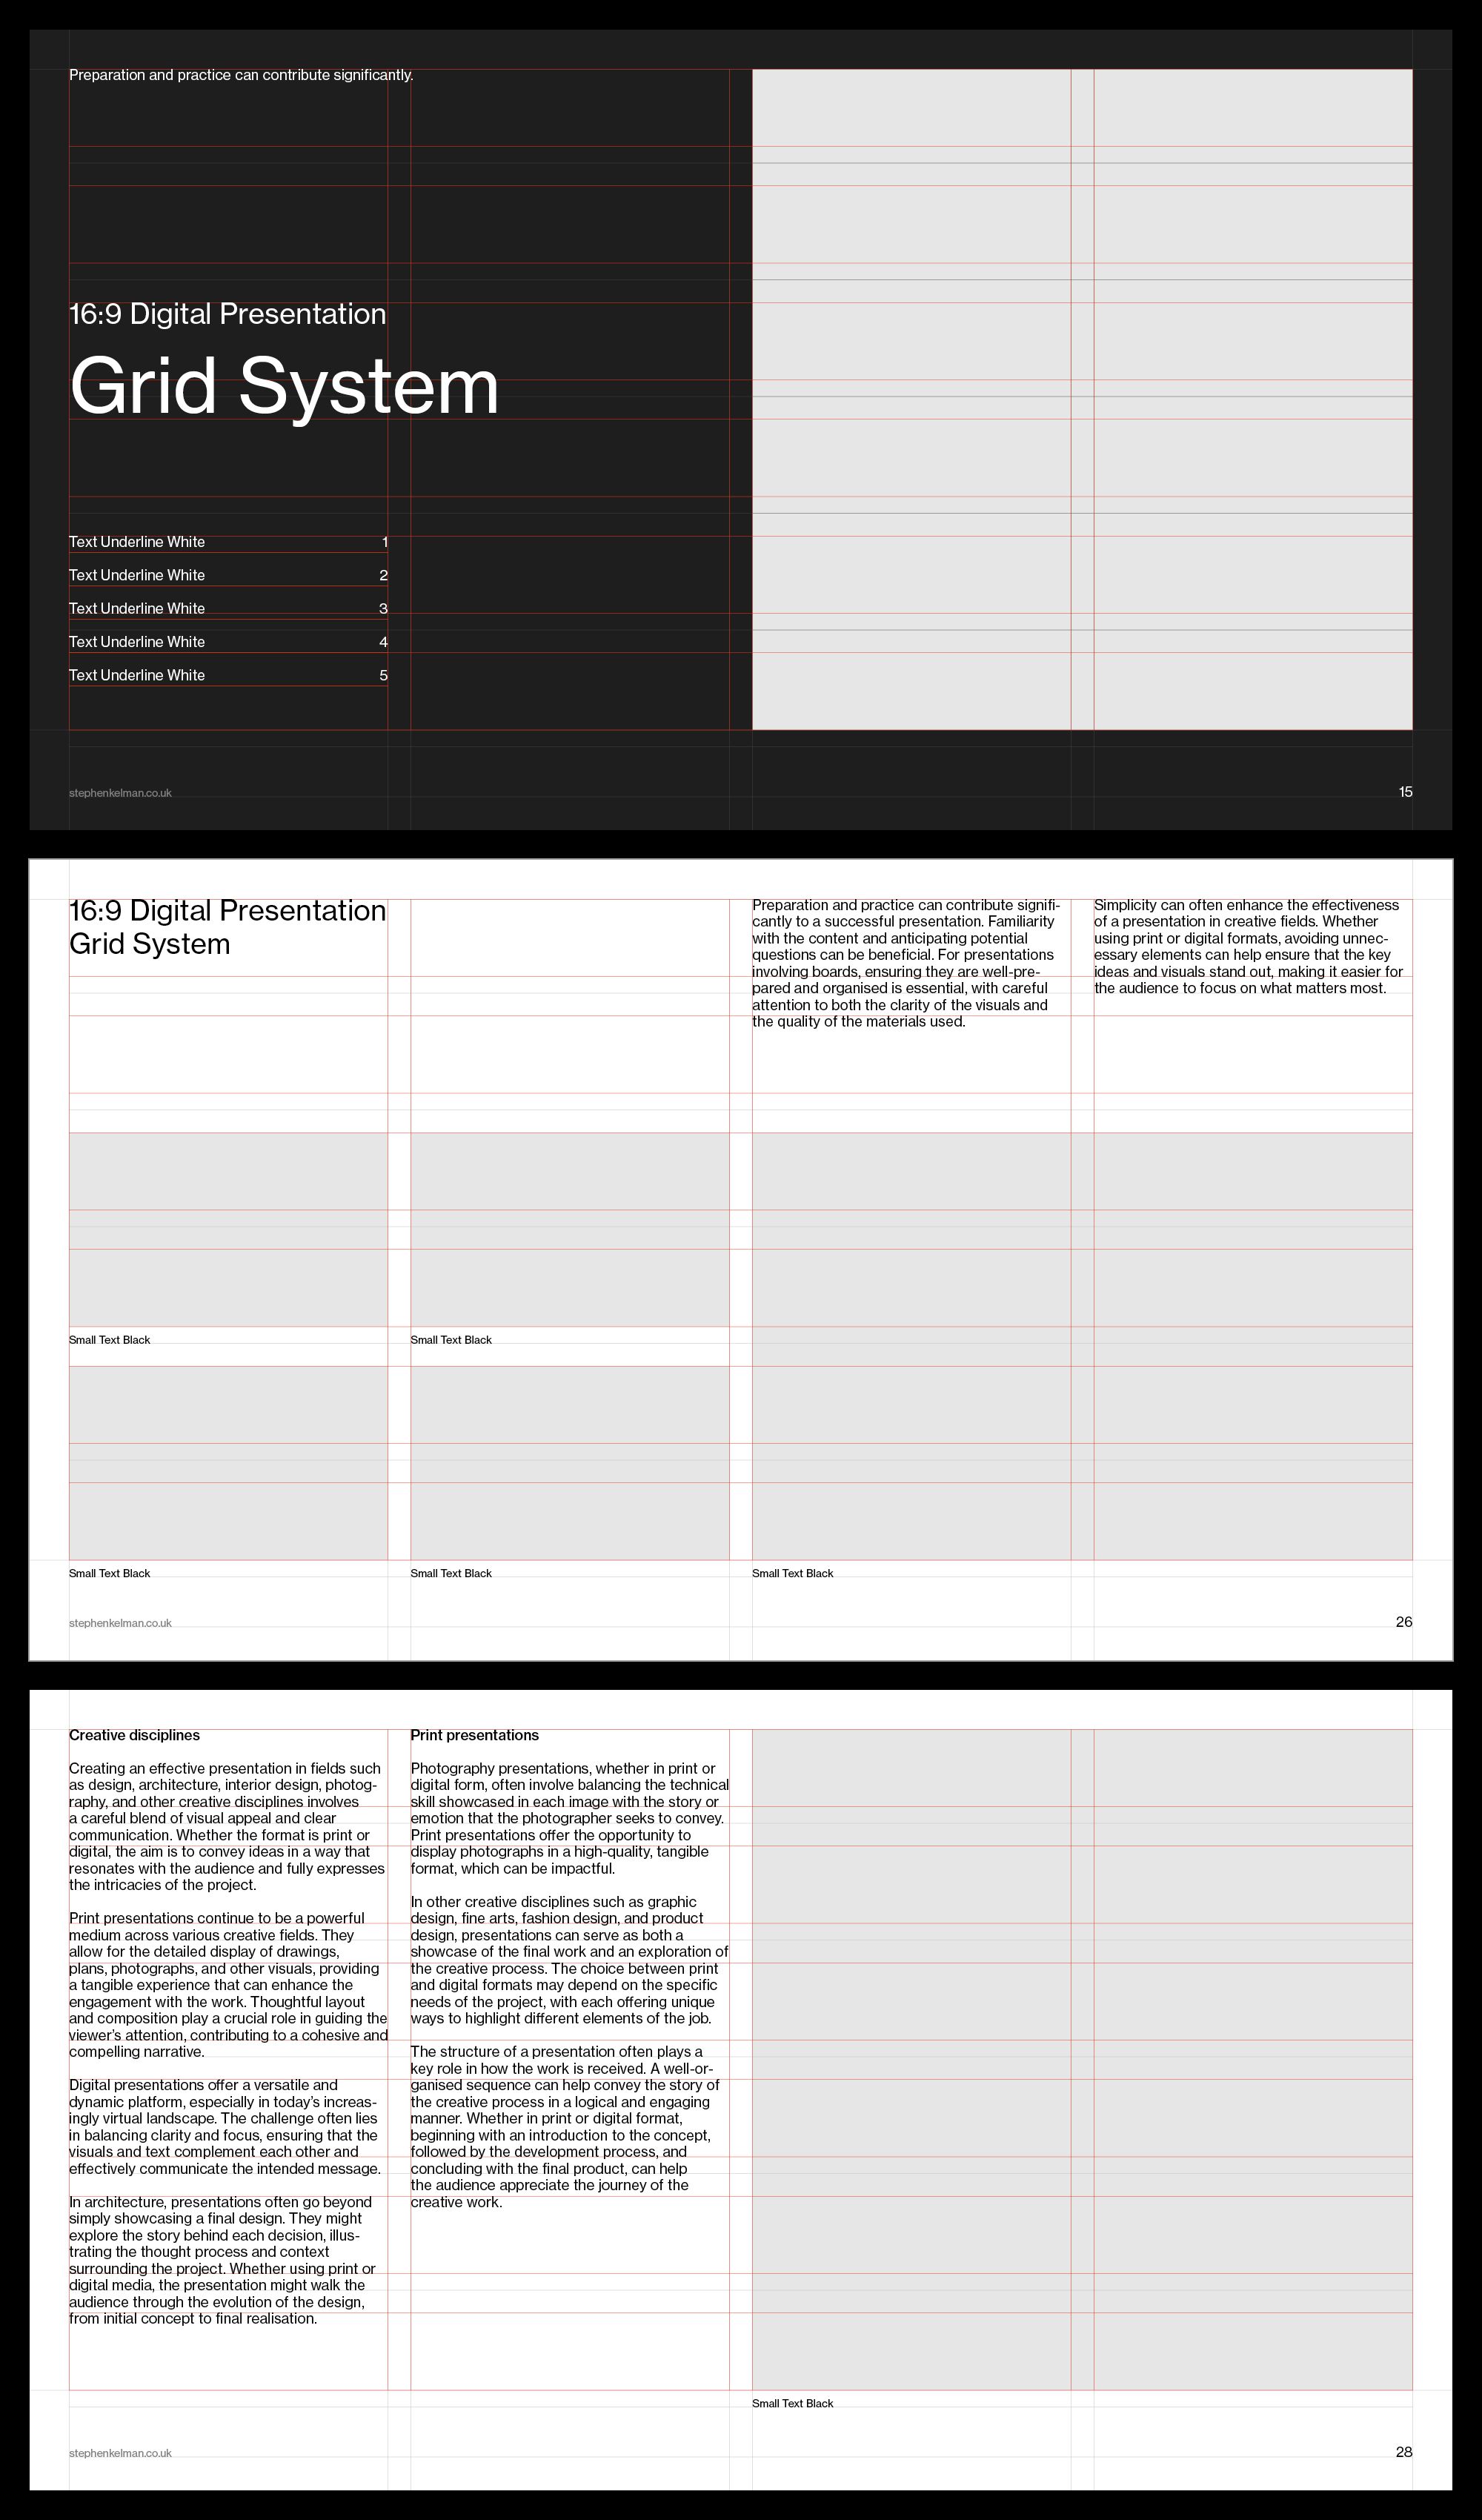
The design employs a stark, minimalist aesthetic centered around a precise grid system to organize technical information. The visual language is highly structured and functional, prioritizing clarity and data presentation over decorative elements.
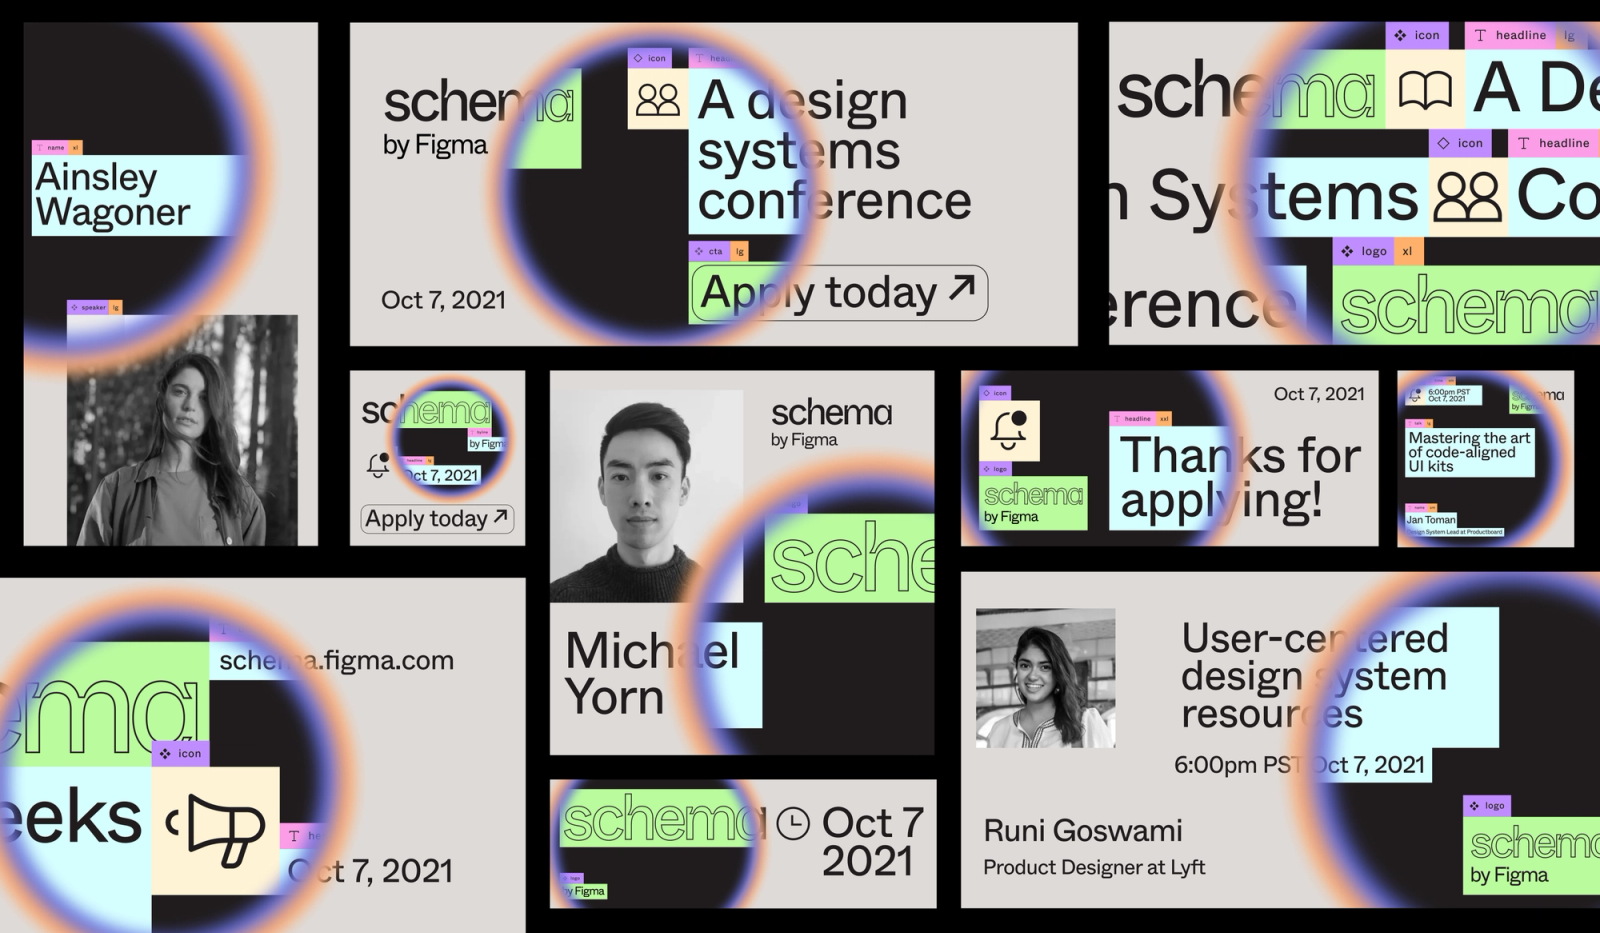
This visual collage presents a clean, professional aesthetic typical of technical design presentations, utilizing dark backgrounds and high-contrast text to convey information about design systems and conferences. The overall feel is modern, informative, and focused on educational or industry-specific content.
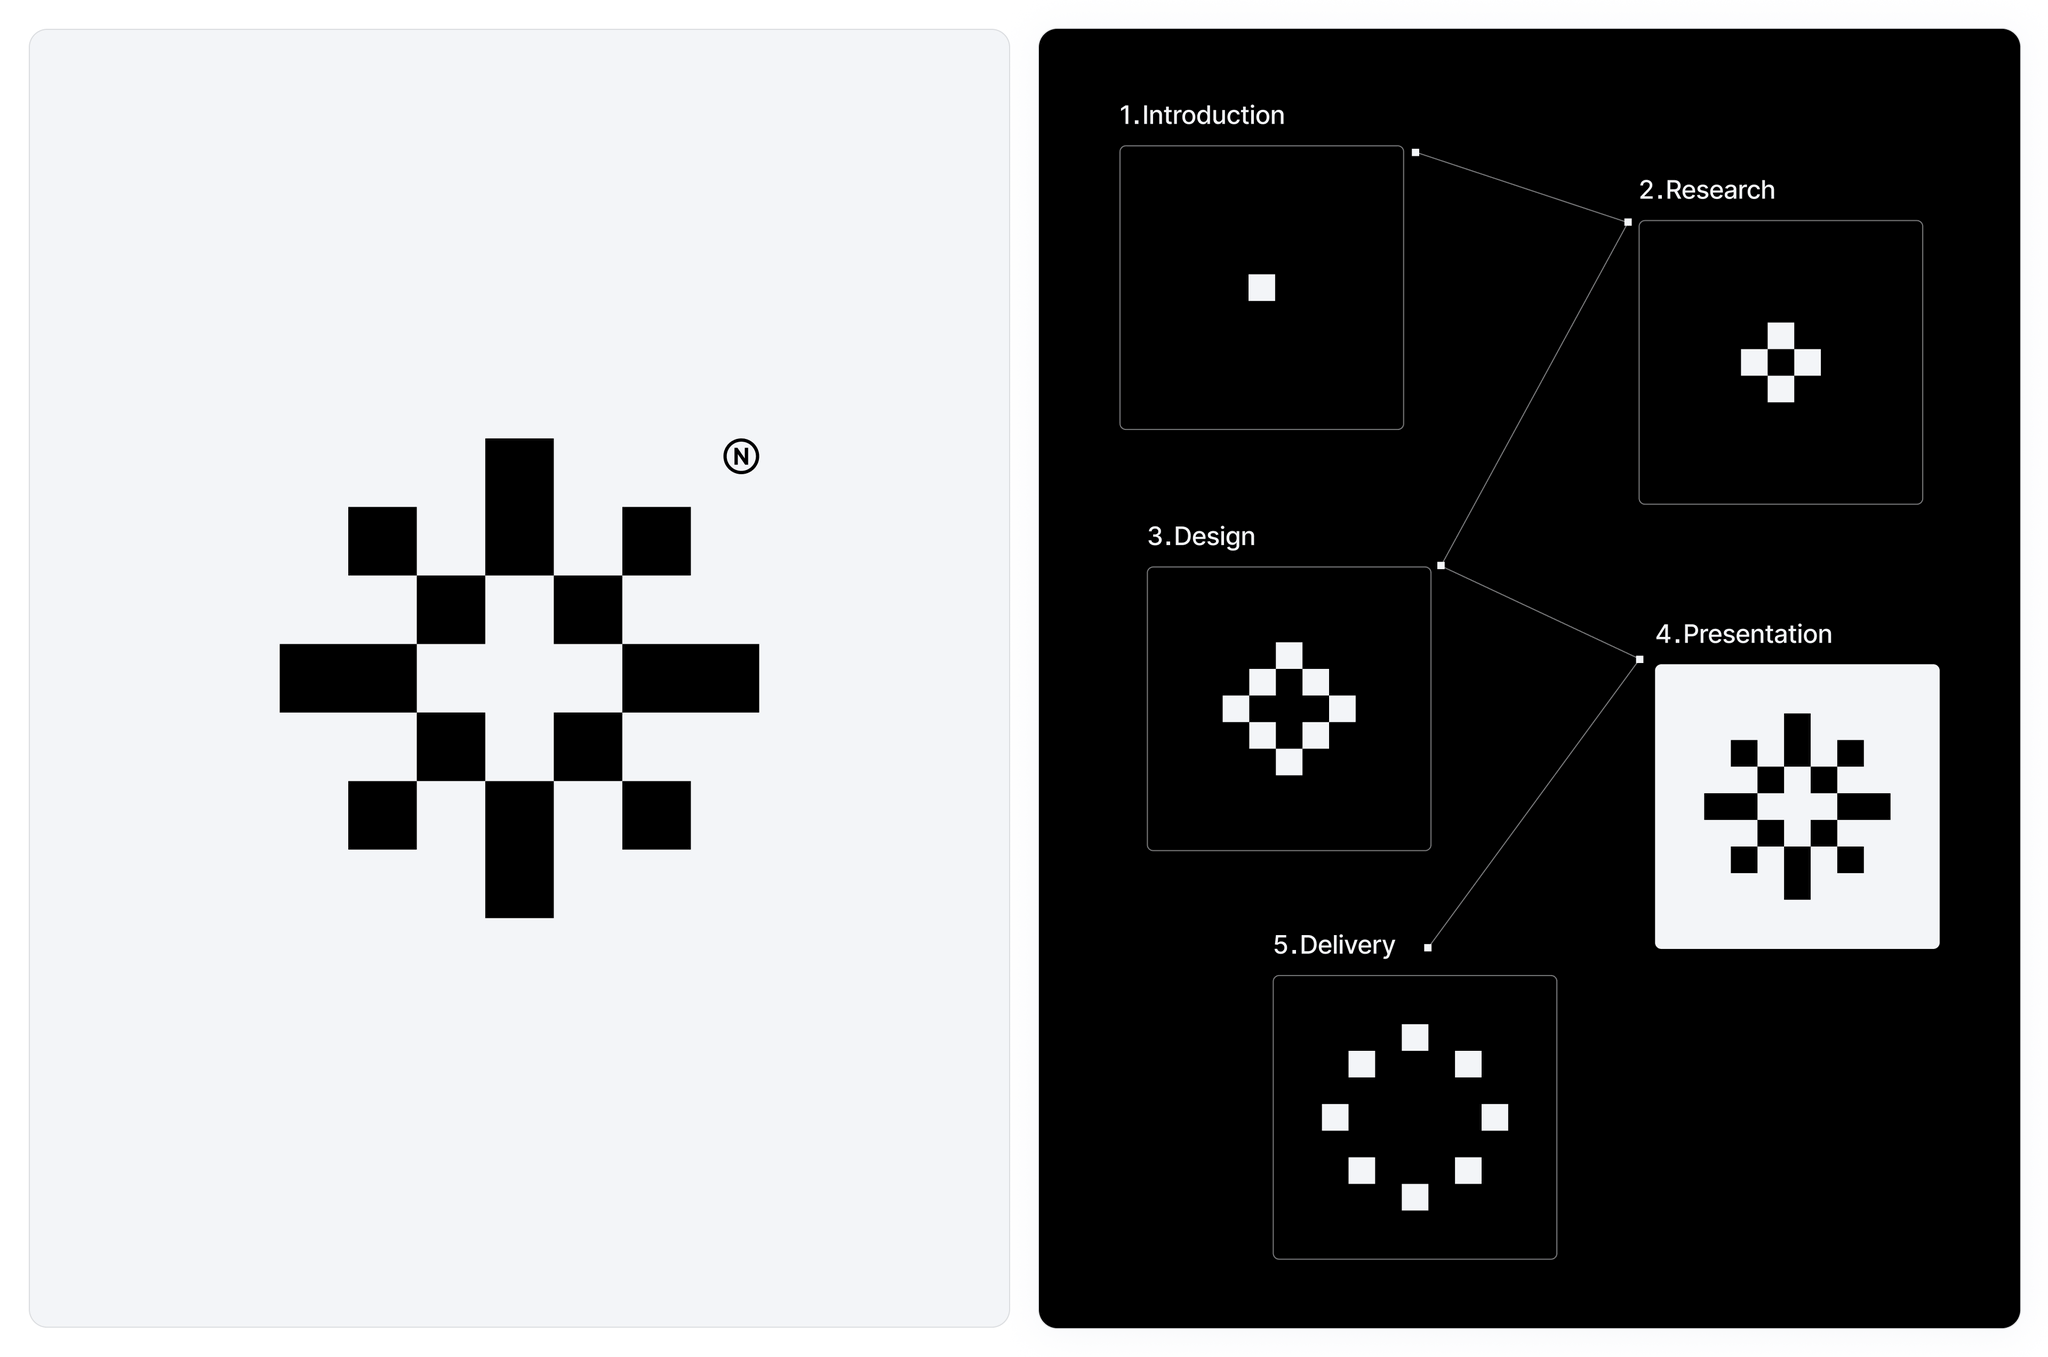
This image presents a clean, minimalist diagrammatic representation of a five-step process flow. The visual language relies heavily on geometric patterns (grids and dots) to symbolize stages, suggesting a structured, analytical approach.
The image presents a minimalist, abstract composition featuring a horizontal band divided into two solid colors, with various circular shapes floating within the upper section. The design employs a muted, earthy tone contrasted by solid blue fields and simple black accents to create a clean, somewhat scientific or conceptual feel.
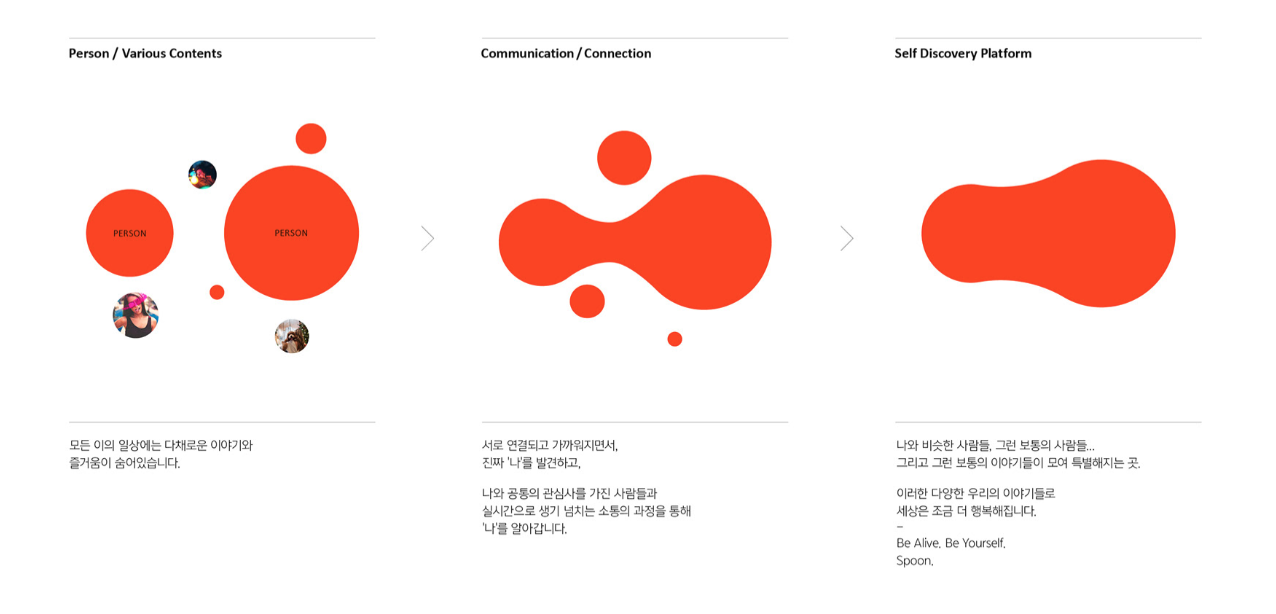
This is a clean, minimalist presentation of three distinct concepts or categories using bold, organic shapes. The design relies heavily on negative space and a limited color palette to create a modern, approachable, and sophisticated feel.
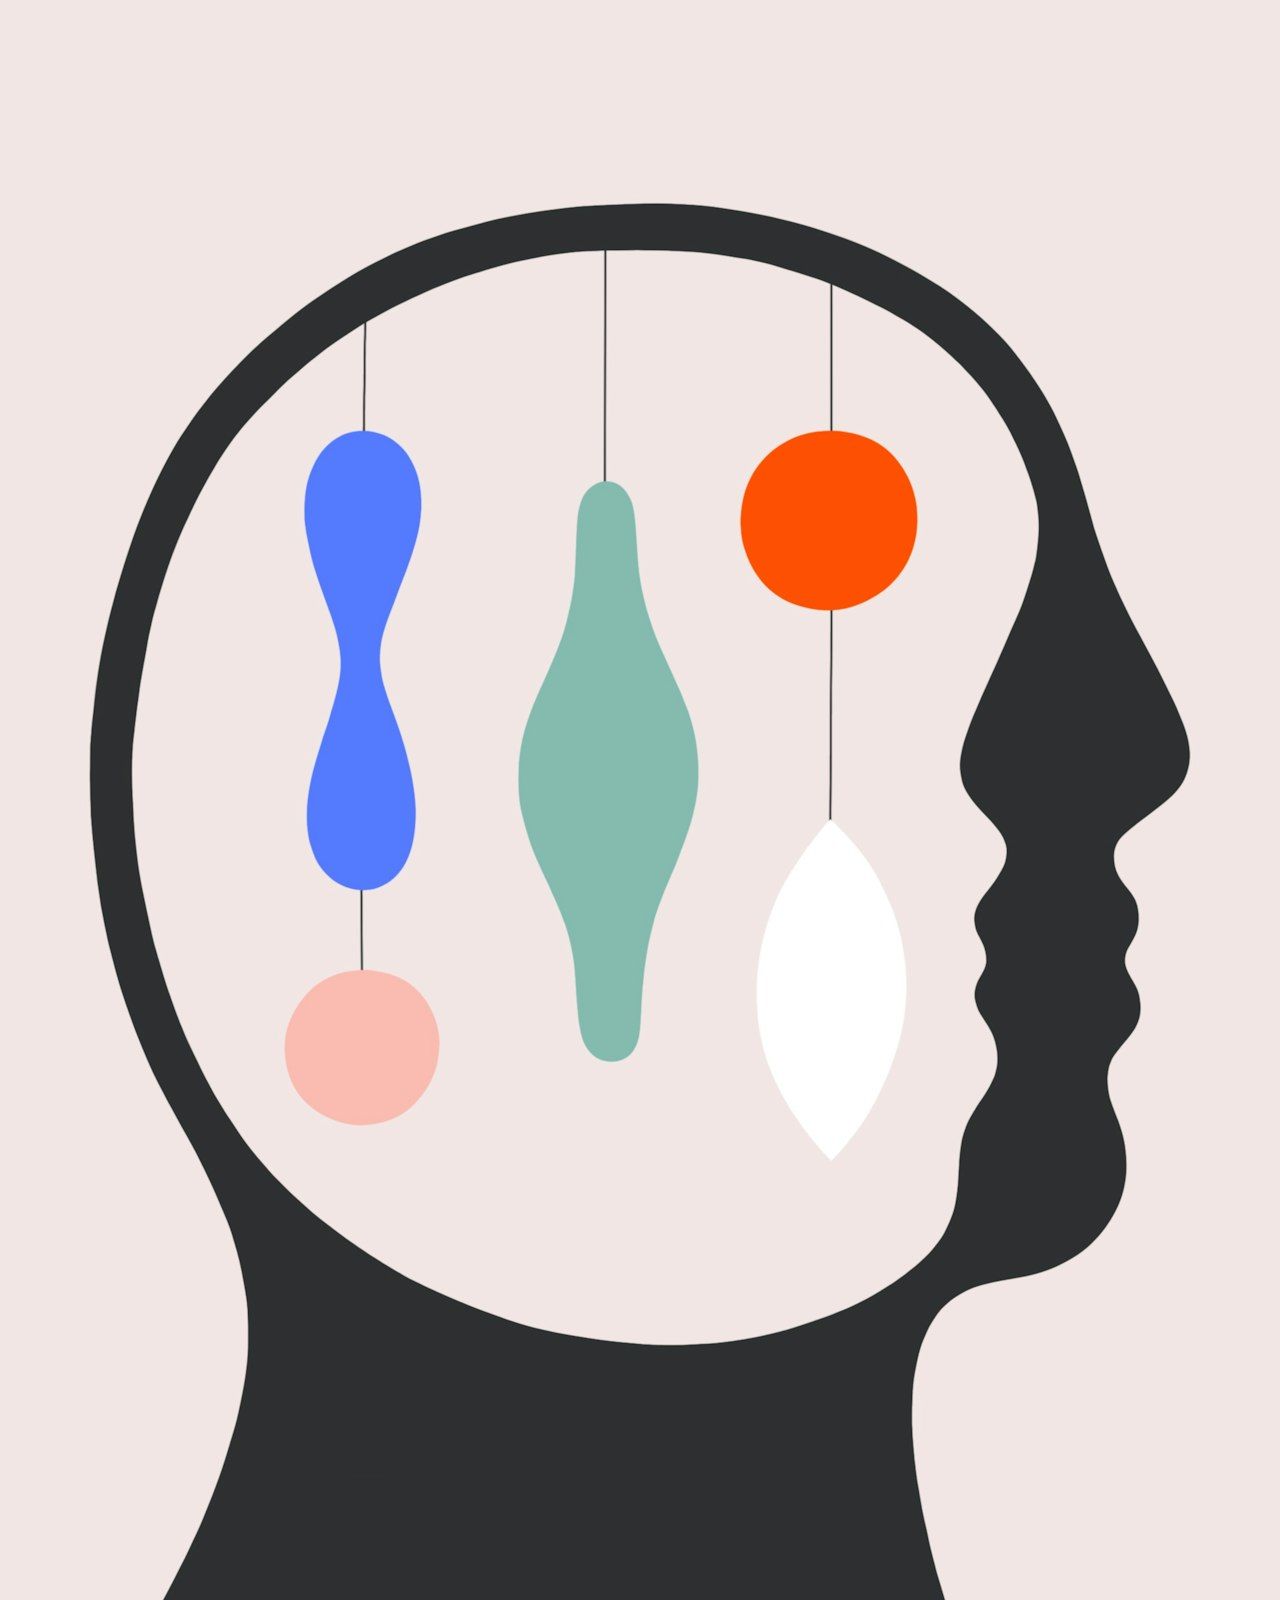
This is a minimalist, abstract illustration depicting a silhouette of a human head with various colored, elongated shapes suspended inside, suggesting concepts or ideas flowing within the mind. The design uses simple geometric forms and a muted, soft color palette to convey a sense of clarity and conceptual thought.
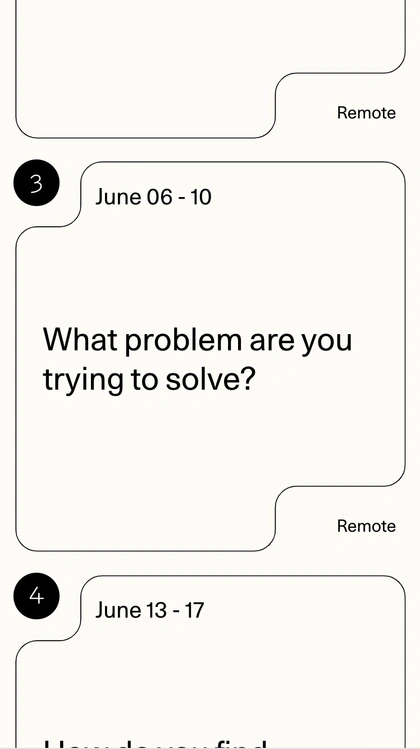
The image presents a minimalist, card-based interface design for a survey or questionnaire, utilizing clean lines and ample white space. The layout is structured sequentially with numbered sections, suggesting a guided user experience.
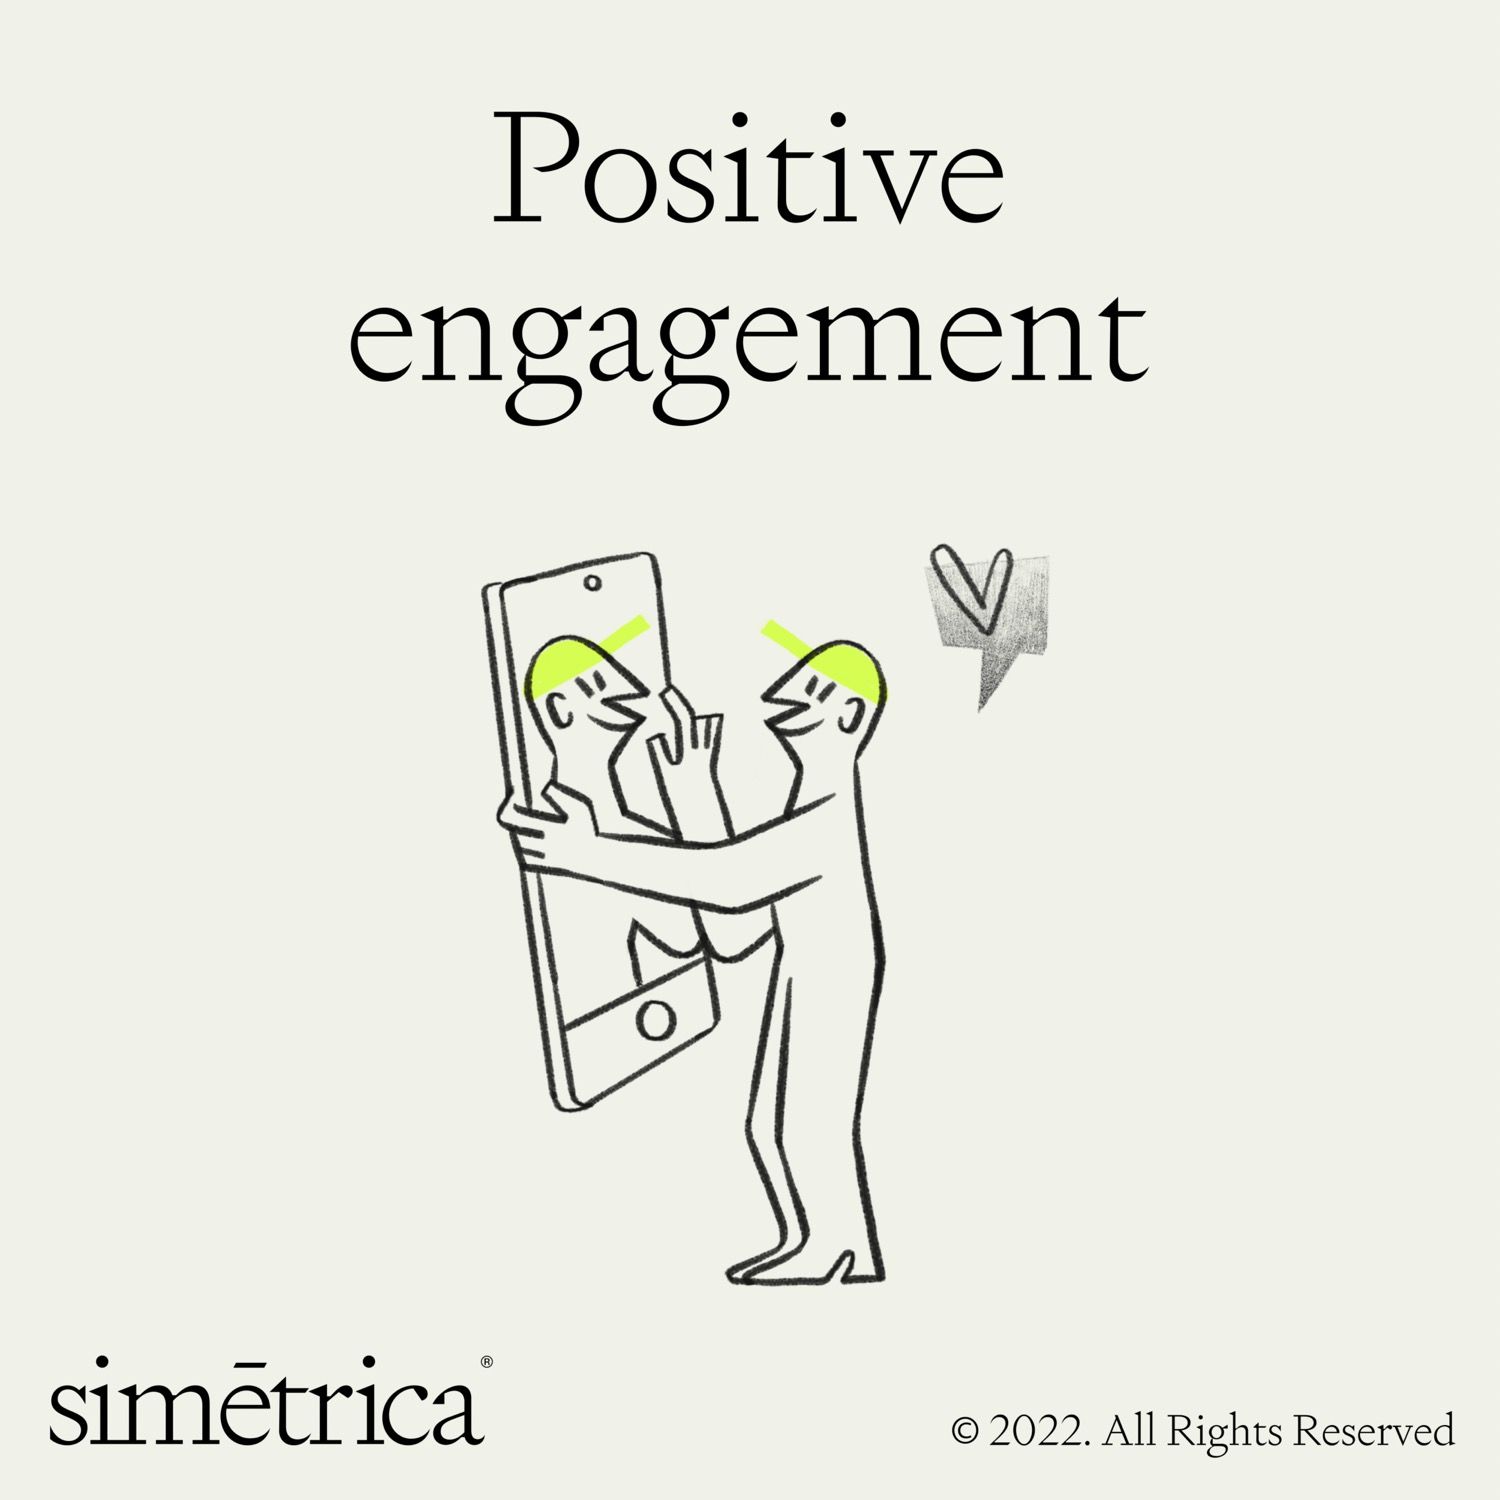
The image features a minimalist line drawing illustrating the concept of 'positive engagement' through an interaction with a smartphone. The design is clean, simple, and uses a monochrome line art style to convey a modern and approachable message.

The image presents a minimalist, clean design featuring simple line art icons against a light background, suggesting a direct and inquisitive tone. The use of distinct colored lines draws the eye through a clear, linear progression.

This image presents a simple, hand-drawn or doodle-like network diagram where various expressive, stylized faces are connected by thin lines, suggesting concepts of connection, emotion mapping, or relationship visualization. The design is lighthearted and informal, relying on simple shapes and clear connectivity to convey its message.
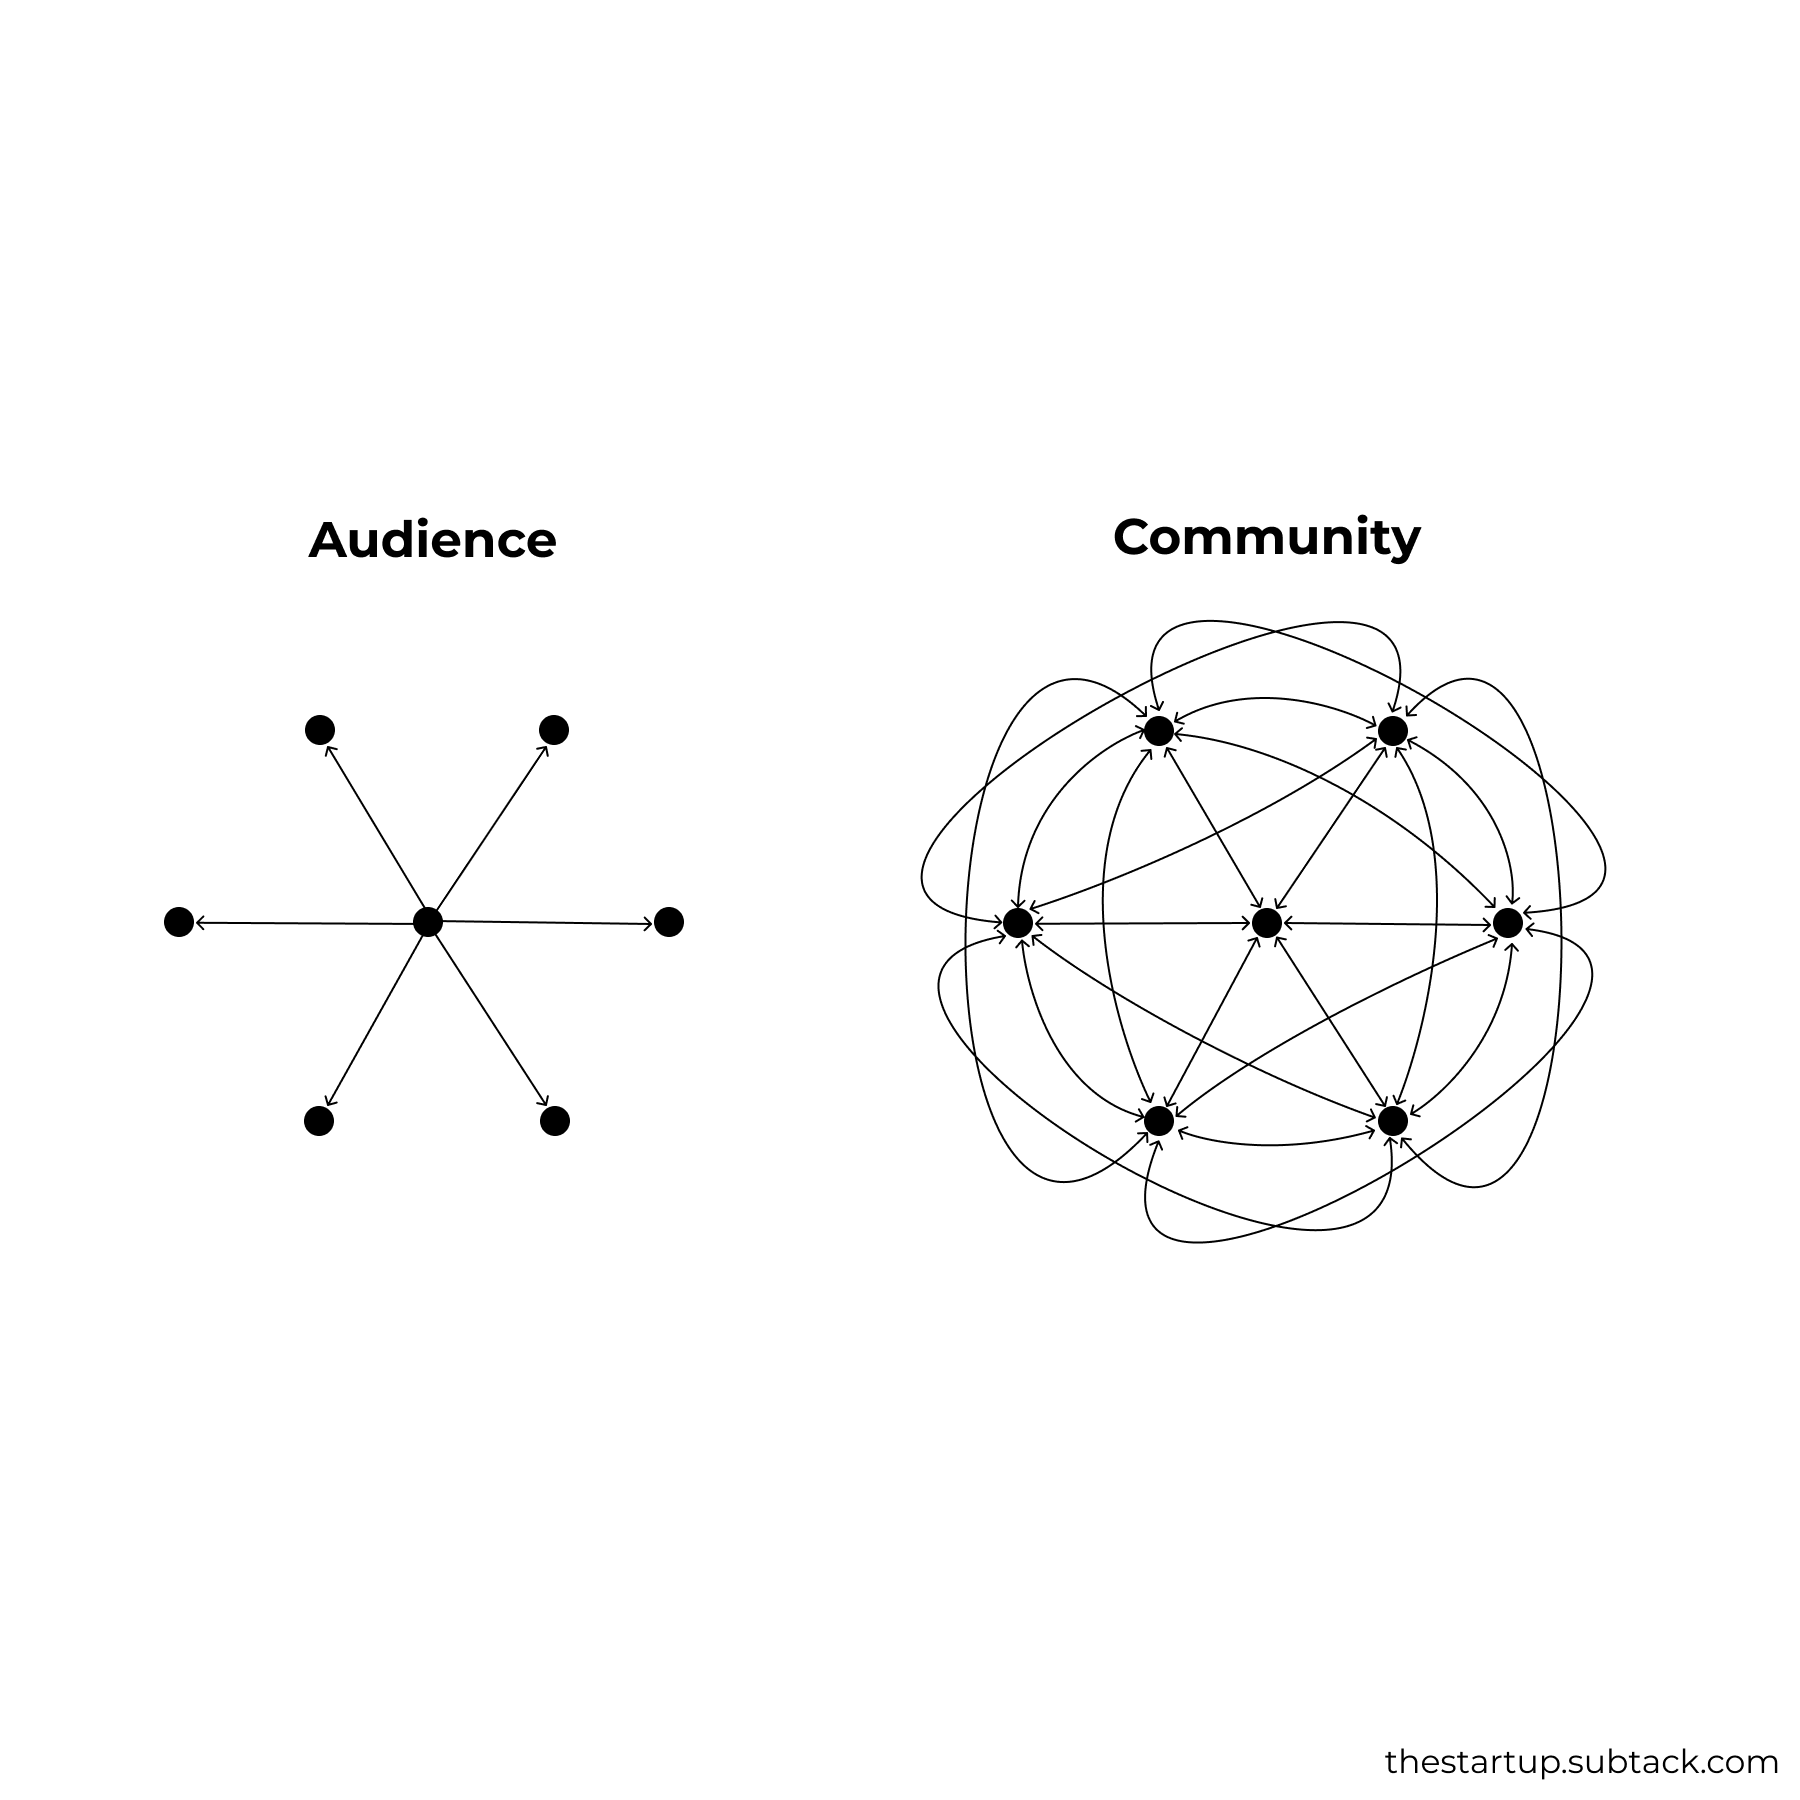
The image presents a minimalist, conceptual comparison between 'Audience' and 'Community' using simple line art diagrams. The visual language is clean, abstract, and relies on geometric representations of connections to convey complex social concepts.
The image presents a minimalist, line-based data visualization or process flow diagram against a dark background. It uses simple geometric shapes and thin lines to illustrate a progression from a 'little feature' to a 'master' concept, suggesting simplicity and clarity.
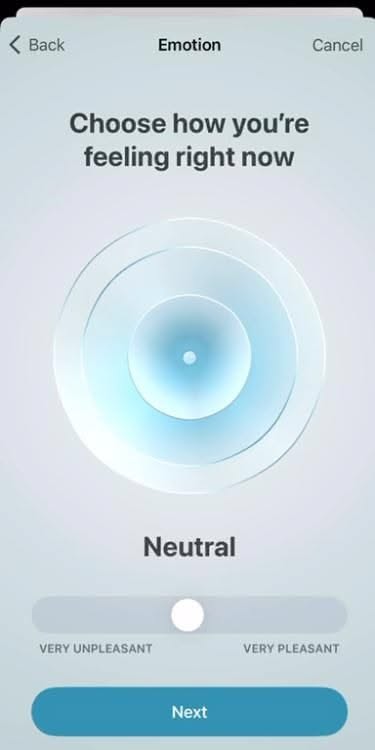
The interface presents a clean, minimalist emotion selection tool using concentric circles to represent a spectrum. The design relies heavily on soft gradients and ample white space to create a calm, intuitive user experience.
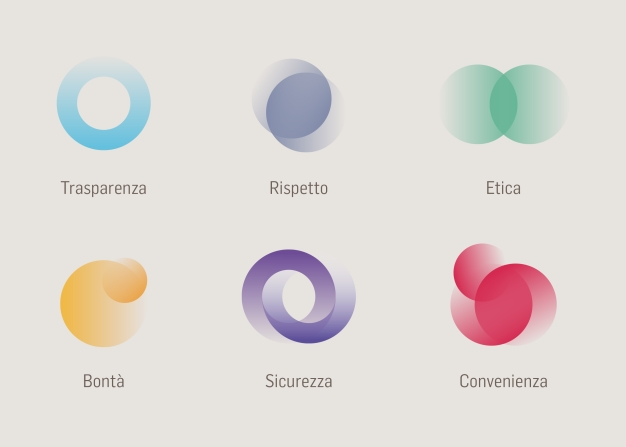
This image presents a clean, minimalist set of six abstract icons or visual concepts arranged in a grid format. The design relies on soft, translucent color gradients and overlapping shapes to symbolize abstract virtues or qualities.
This image presents a minimalist, hand-drawn style network or connection diagram using simple, expressive icons. The visual language is lighthearted and friendly, relying on organic lines and cheerful shapes to suggest relationships or data flow.
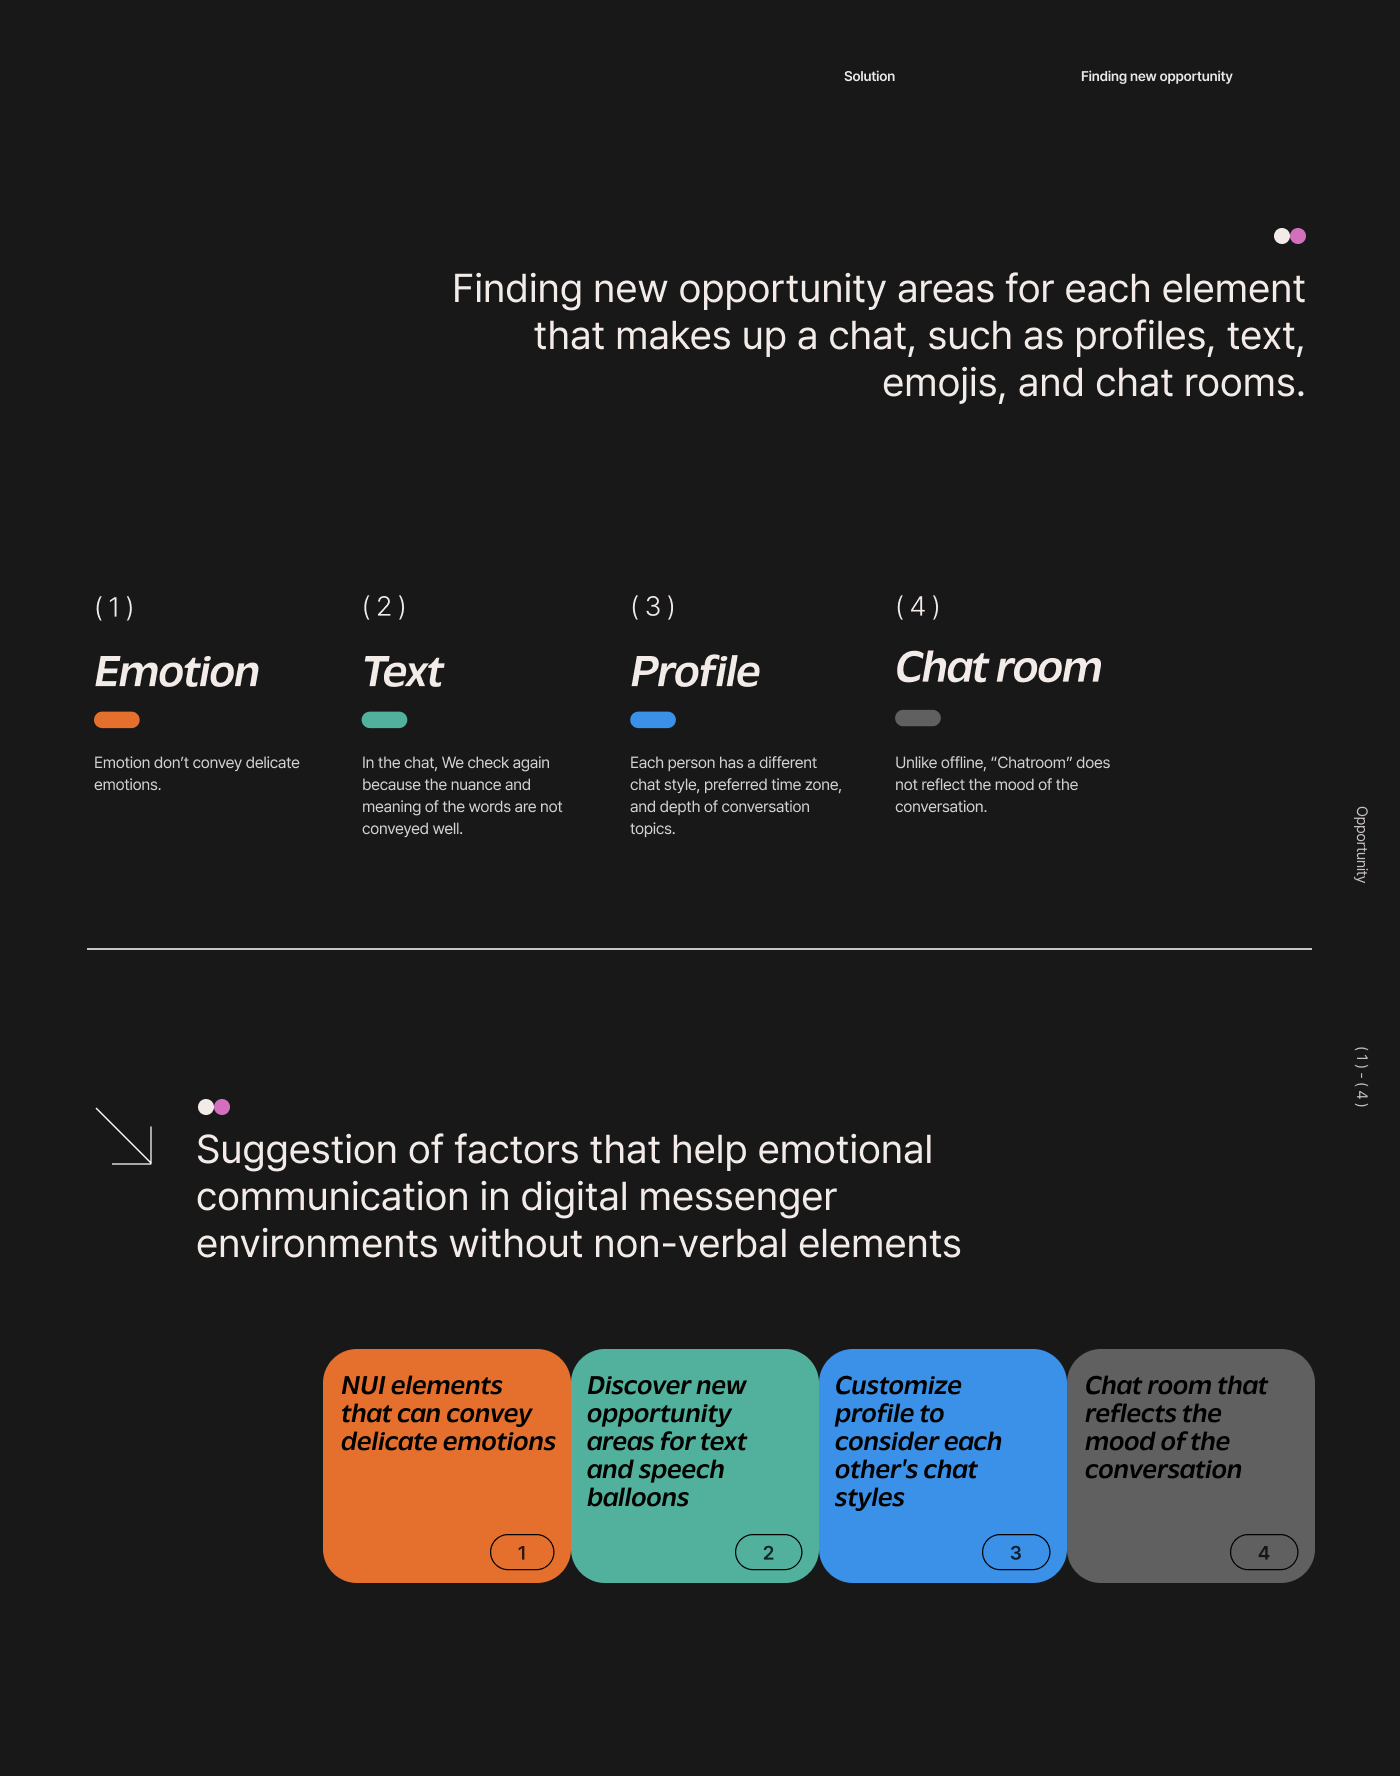
The design is clean, minimalist, and professional, utilizing a dark background with light text and subtle segmentation to present information clearly. The visual language is modern and functional, focusing on breaking down complex concepts into discrete elements.

The image showcases a modern, clean interface design displayed on a tablet resting on a textured, warm-toned surface. The visual language is minimalist and structured, utilizing strong geometric patterns in the background to provide visual interest without overwhelming the main content area.
The image features a minimalist, abstract composition dominated by a vibrant blue background and scattered white dots forming an irregular pattern. The design relies heavily on negative space and the distribution of simple geometric elements to create a sense of texture or data visualization.
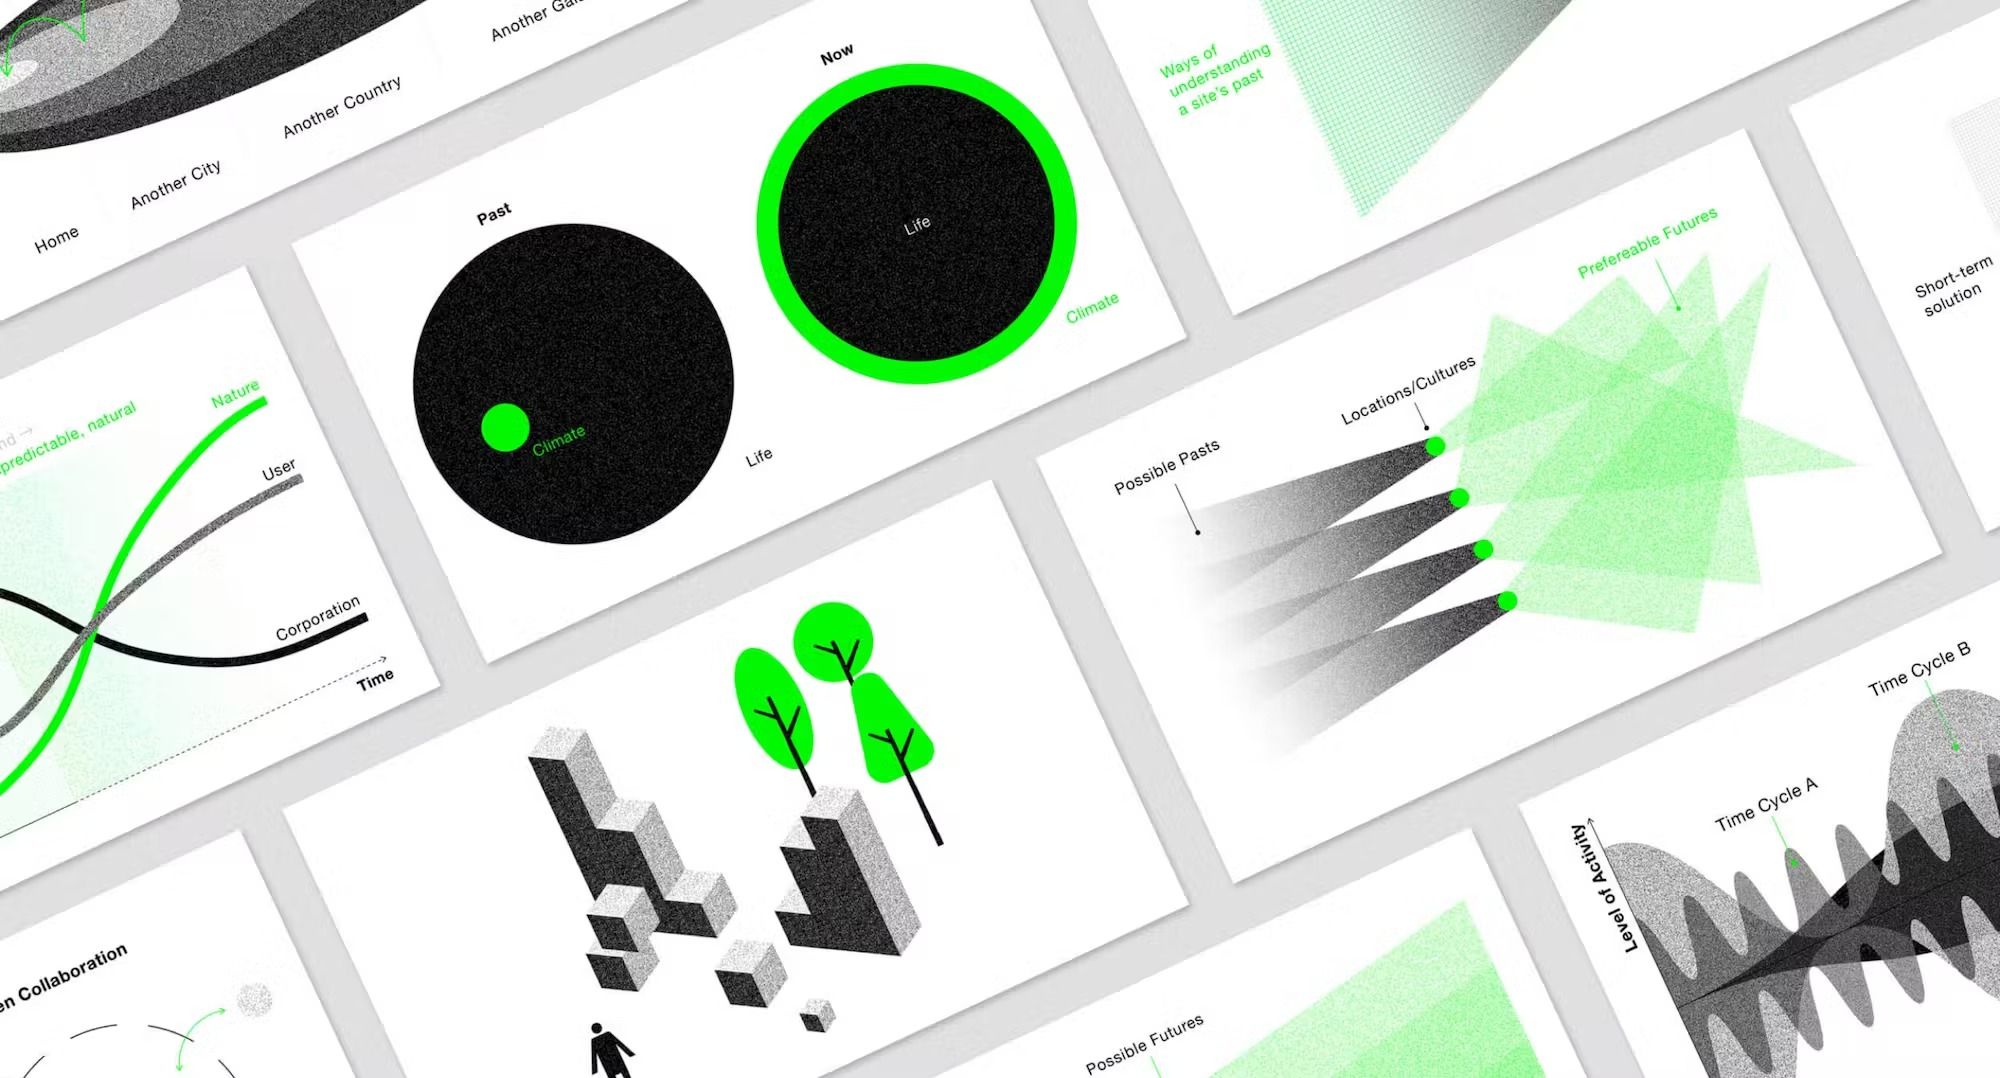
The image displays a set of modern, infographic-style diagrams using a clean, minimalist aesthetic. It employs a limited color palette dominated by shades of green and black/dark gray to represent concepts like life cycles or processes. The overall feel is professional, data-driven, and contemporary.