infographics
42 designs
Showing 24 of 42 (42 total)
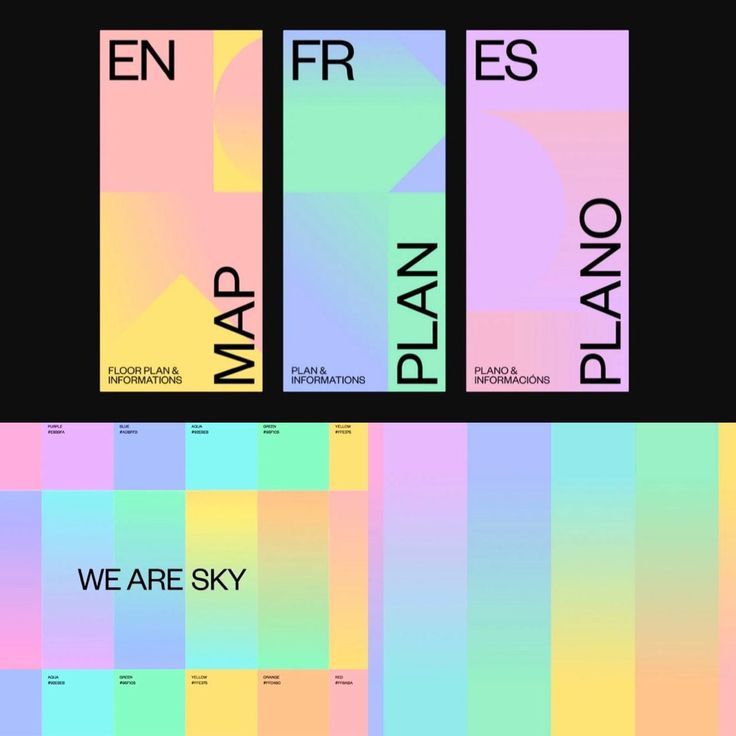
This design employs a soft, contemporary aesthetic characterized by smooth, expansive color gradients and minimalist typography. The visual language is airy and conceptual, suggesting themes of planning, space, and open possibility.

This image showcases a collection of abstract geometric shapes and simple icons rendered in a clean, flat design style. The visual language relies heavily on negative space and precise lines to convey concepts related to data, structure, or connectivity. The overall feel is modern, organized, and highly conceptual.
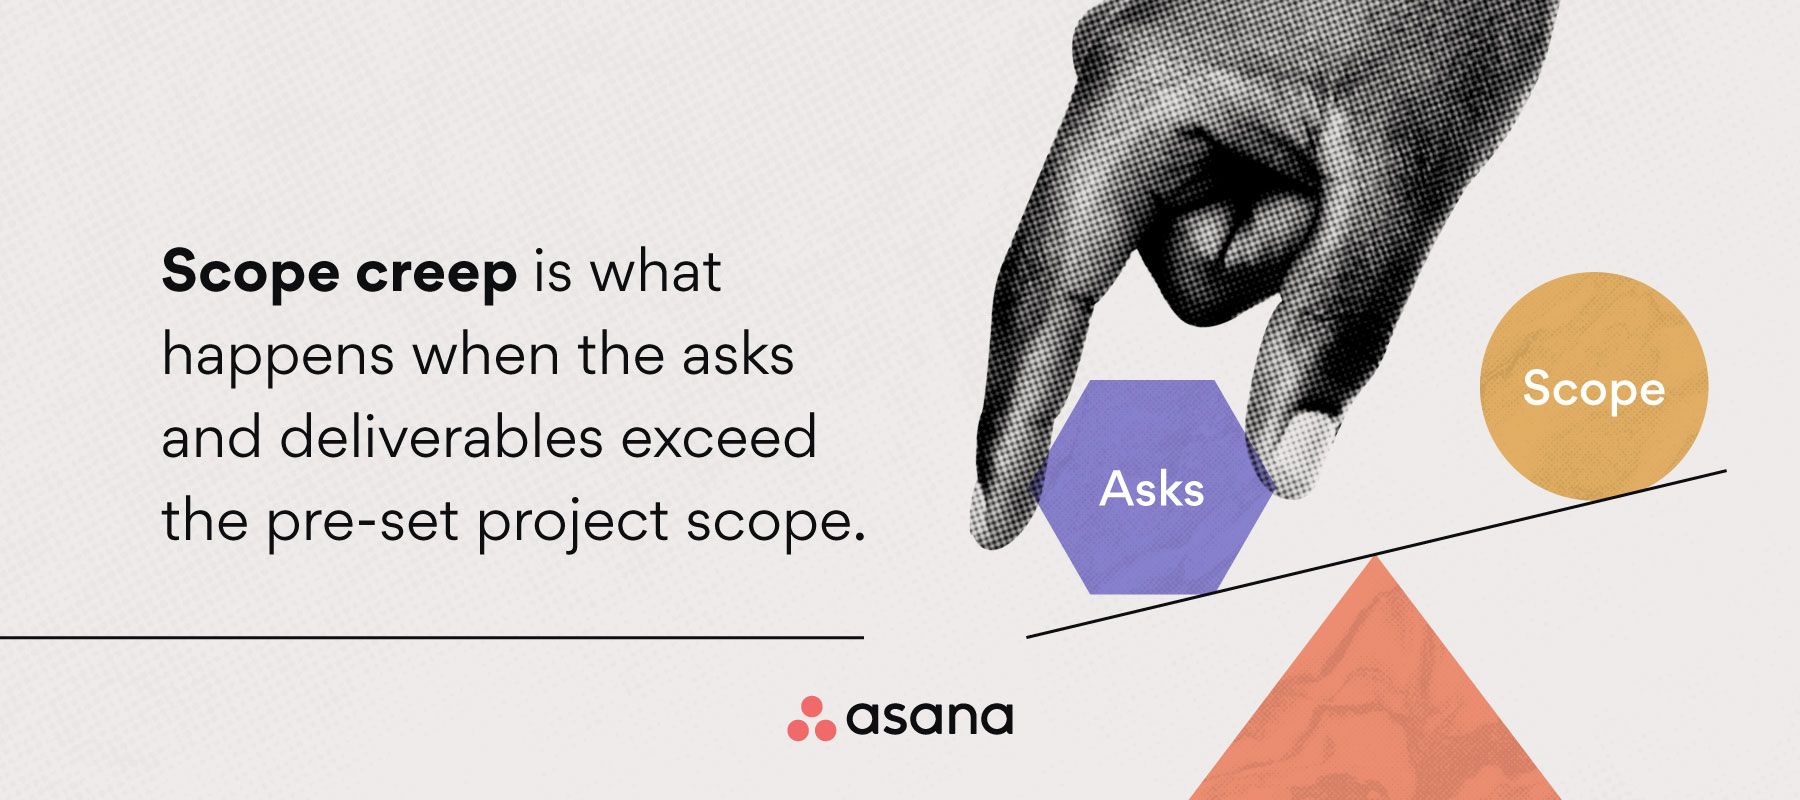
This is a clean, professional infographic design using simple geometric shapes and limited color contrast to explain a project management concept. The visual language is modern and analytical, effectively uses negative space to draw attention to the relationship between 'Scope' and 'Asks.'
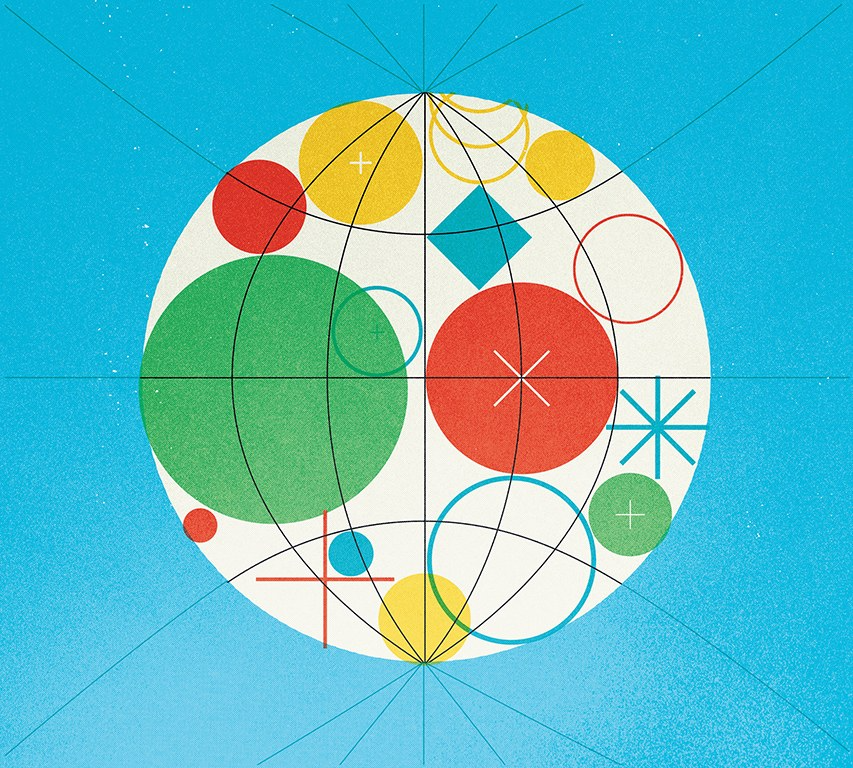
This is a vibrant, geometric graphic design featuring various colored shapes contained within a central white circle set against a bright cyan background. The visual language is clean, modern, and playful, utilizing simple shapes and radial lines to suggest a map or abstract data visualization.
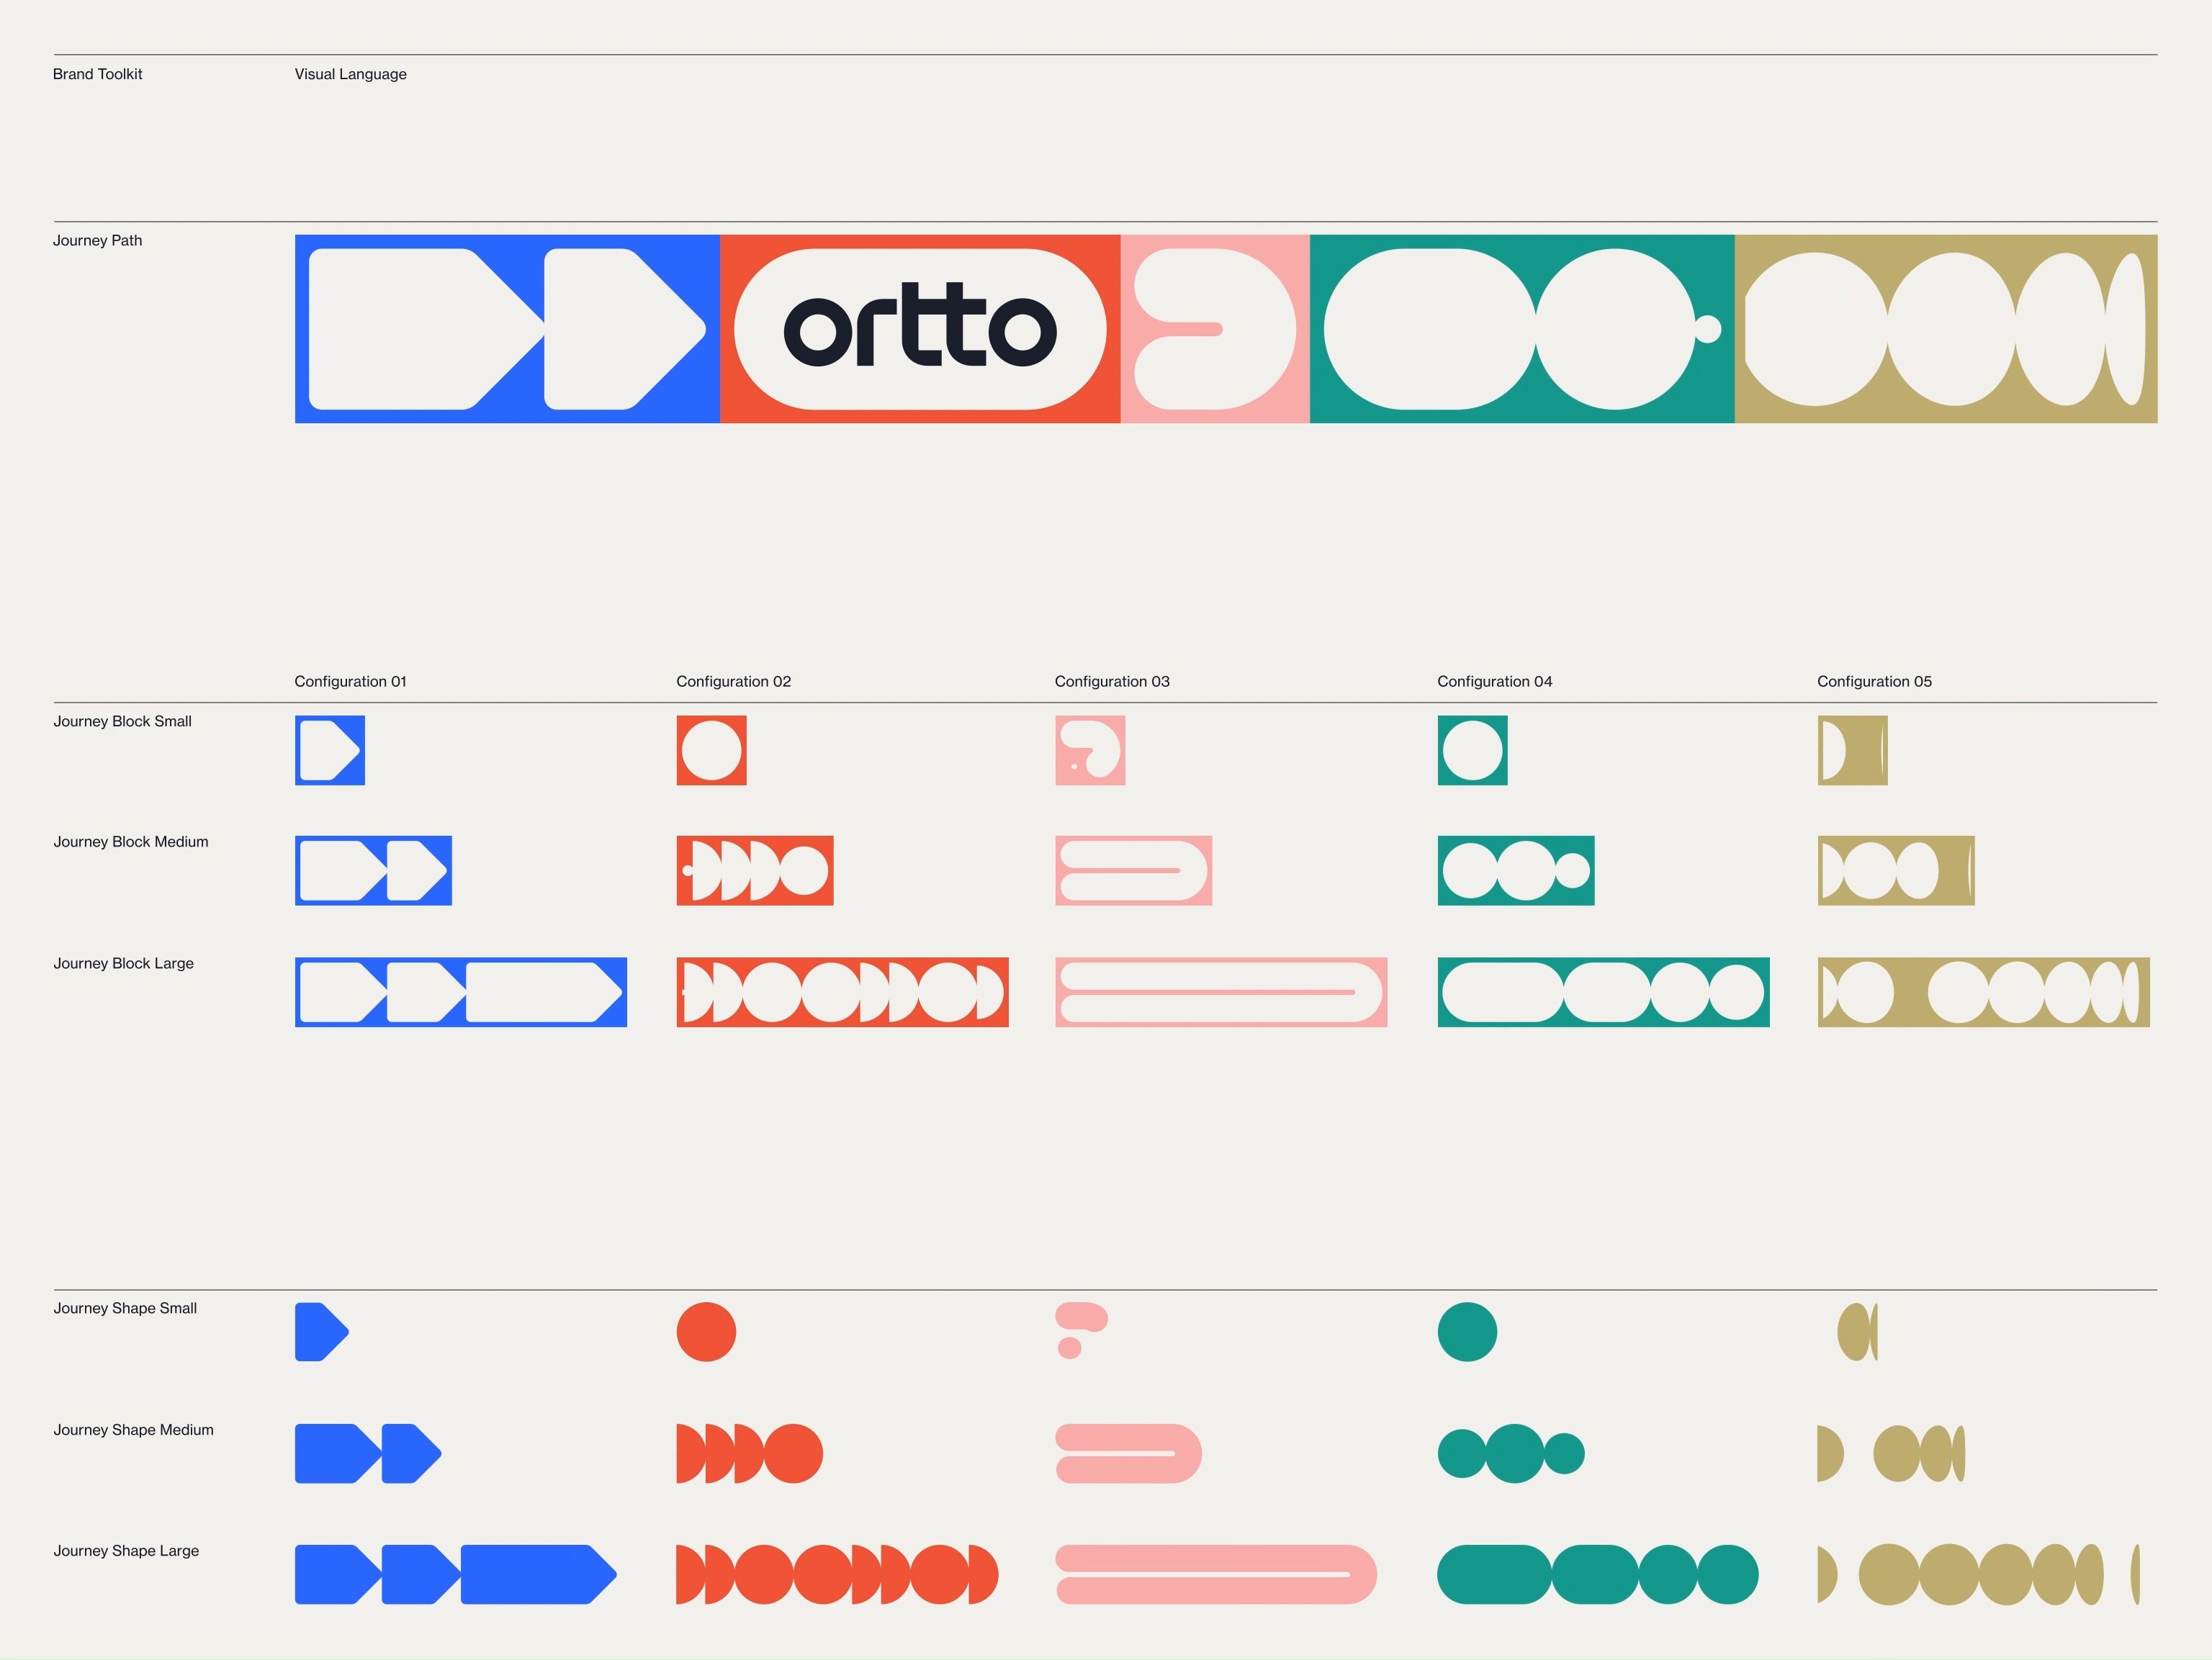
This image showcases a systematic exploration of visual language, utilizing modular geometric shapes and a distinct color palette to represent different configurations or journey paths. The design emphasizes clarity, consistency, and the relationship between shape, color, and size through a clean, modern aesthetic.
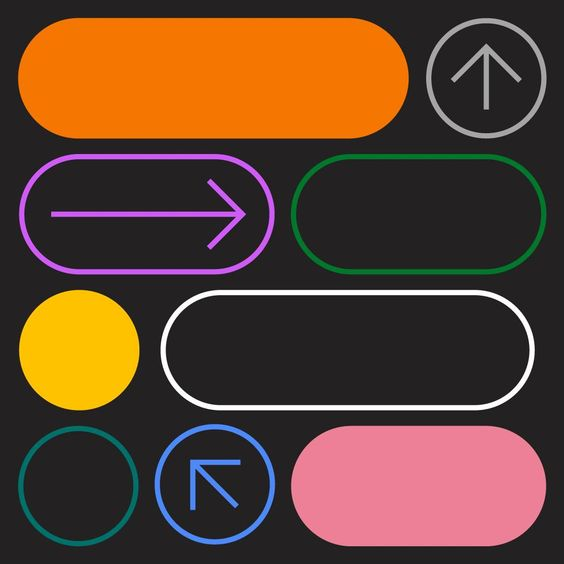
This image showcases a collection of vibrant, flat design elements and directional icons, utilizing bold colors and smooth, rounded geometric shapes. The visual language is clean, modern, and highly functional, designed to serve as clear indicators or buttons within a user interface.
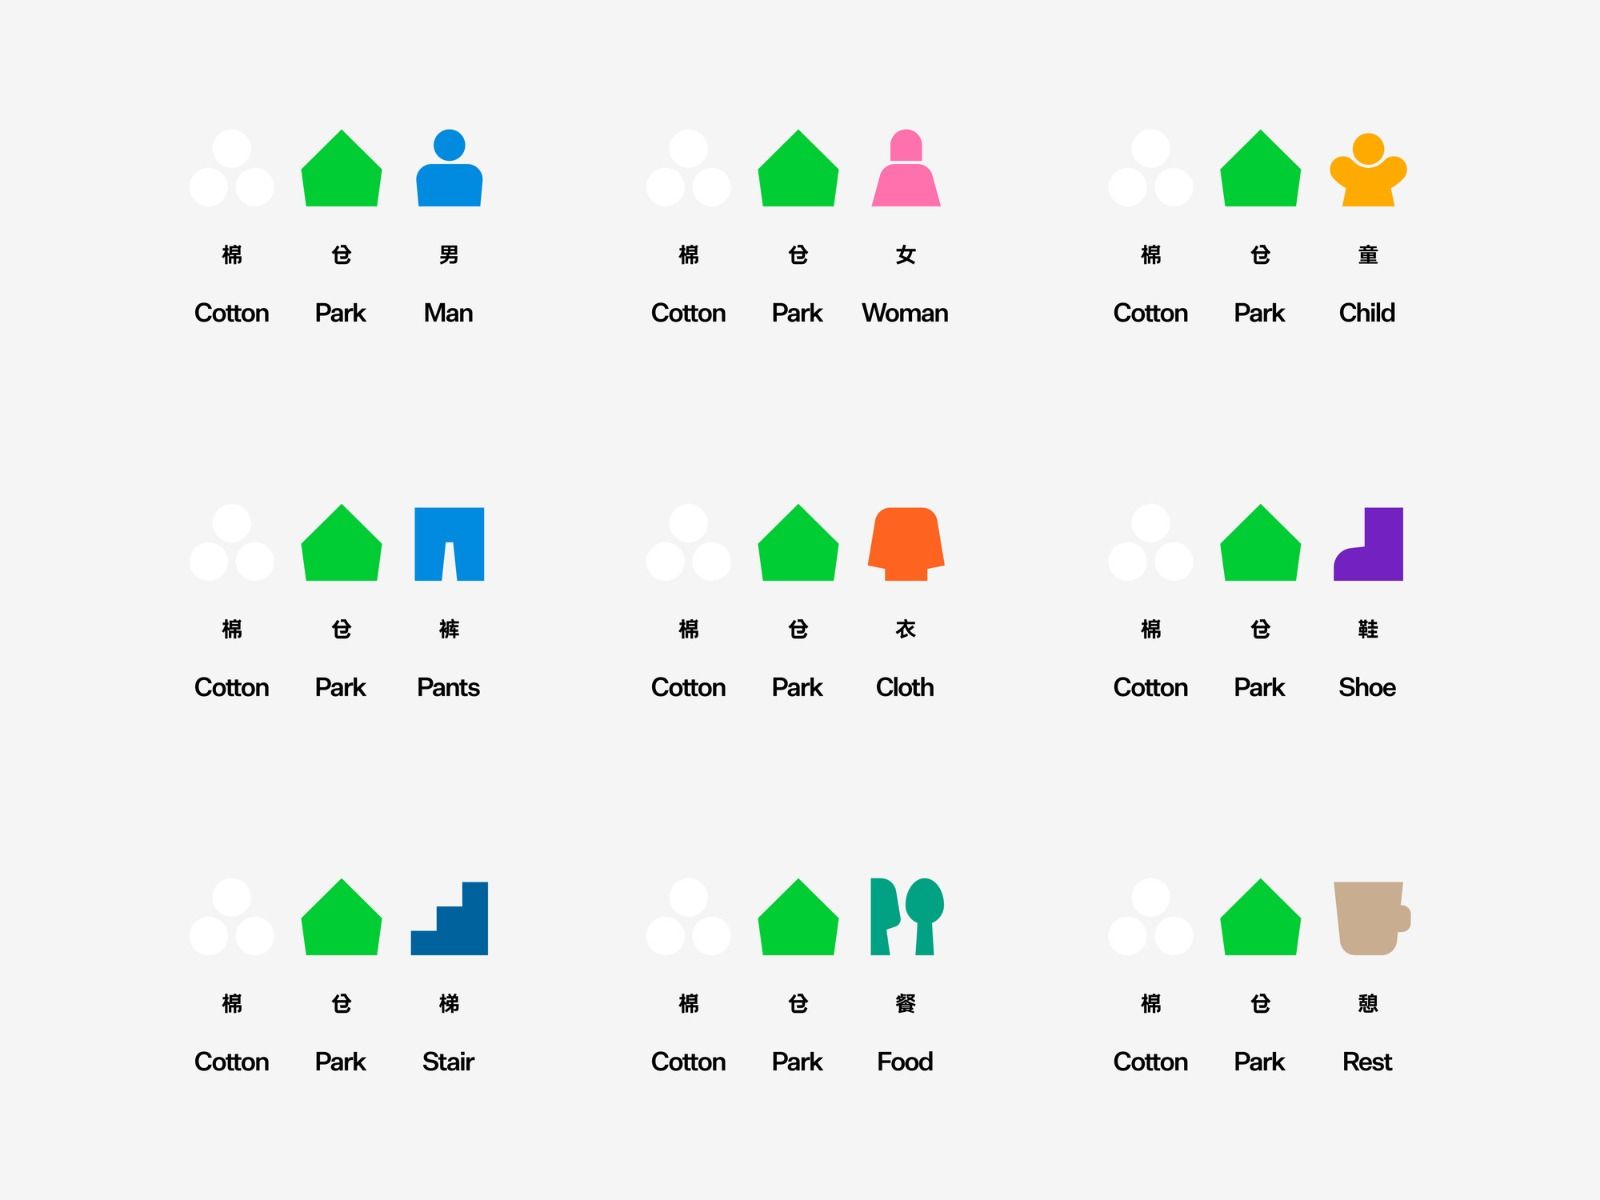
This image presents a clean, minimalist iconographic set designed for clear categorization or labeling. The visual language relies on simple, recognizable geometric shapes paired with small, distinct human figures to represent concepts like materials, people, and objects. The overall feel is functional, organized, and modern.
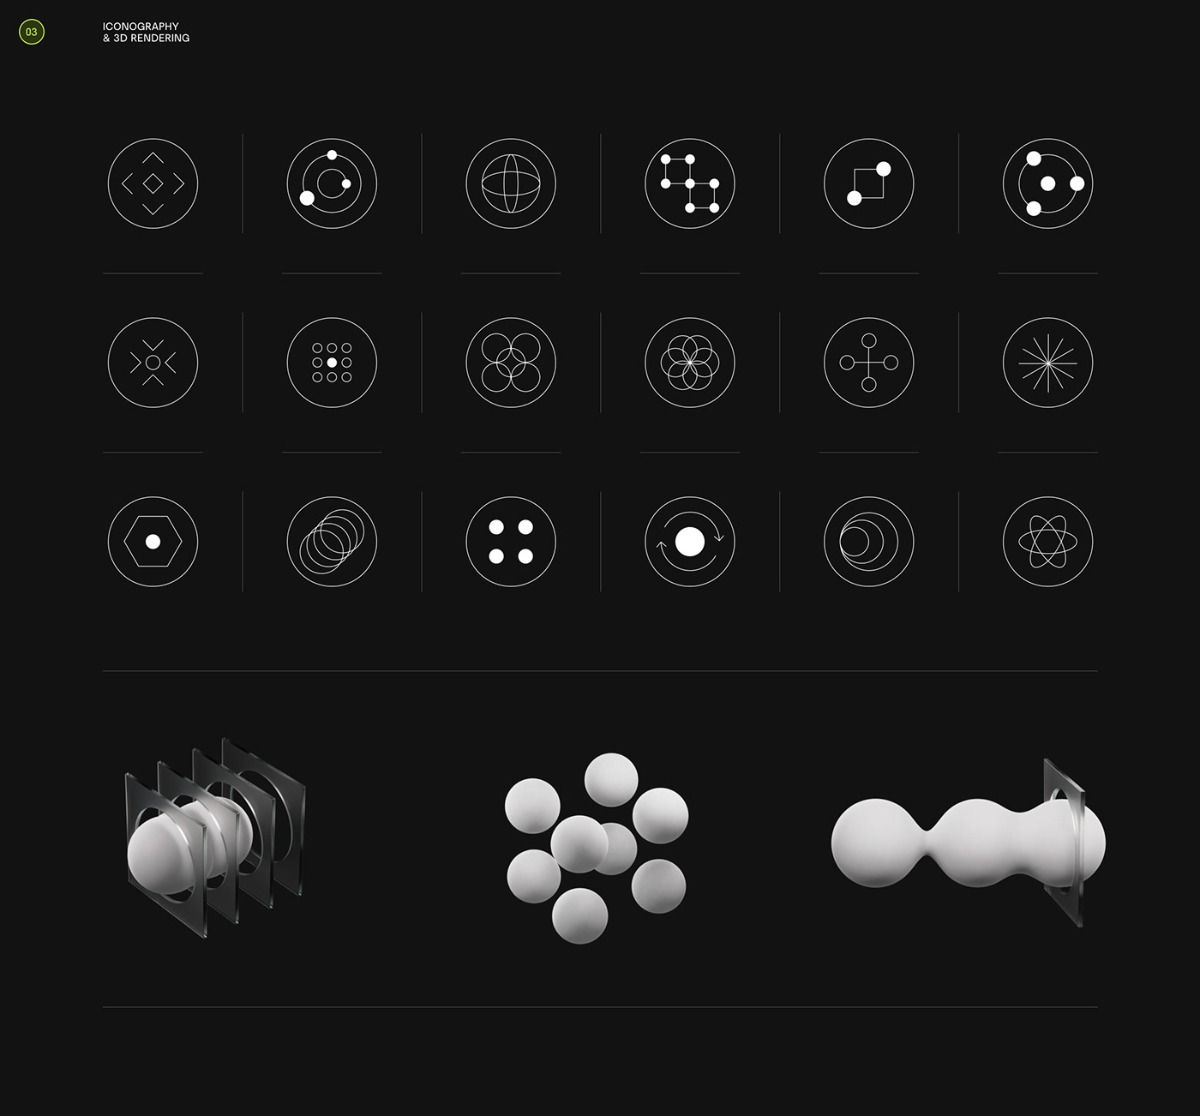
This image presents a clean, monochrome set of abstract geometric icons and 3D rendered shapes, suggesting a focus on technical diagrams, network concepts, or minimalist UI elements. The visual language is precise and modern, relying heavily on line work and subtle shading to convey complexity.
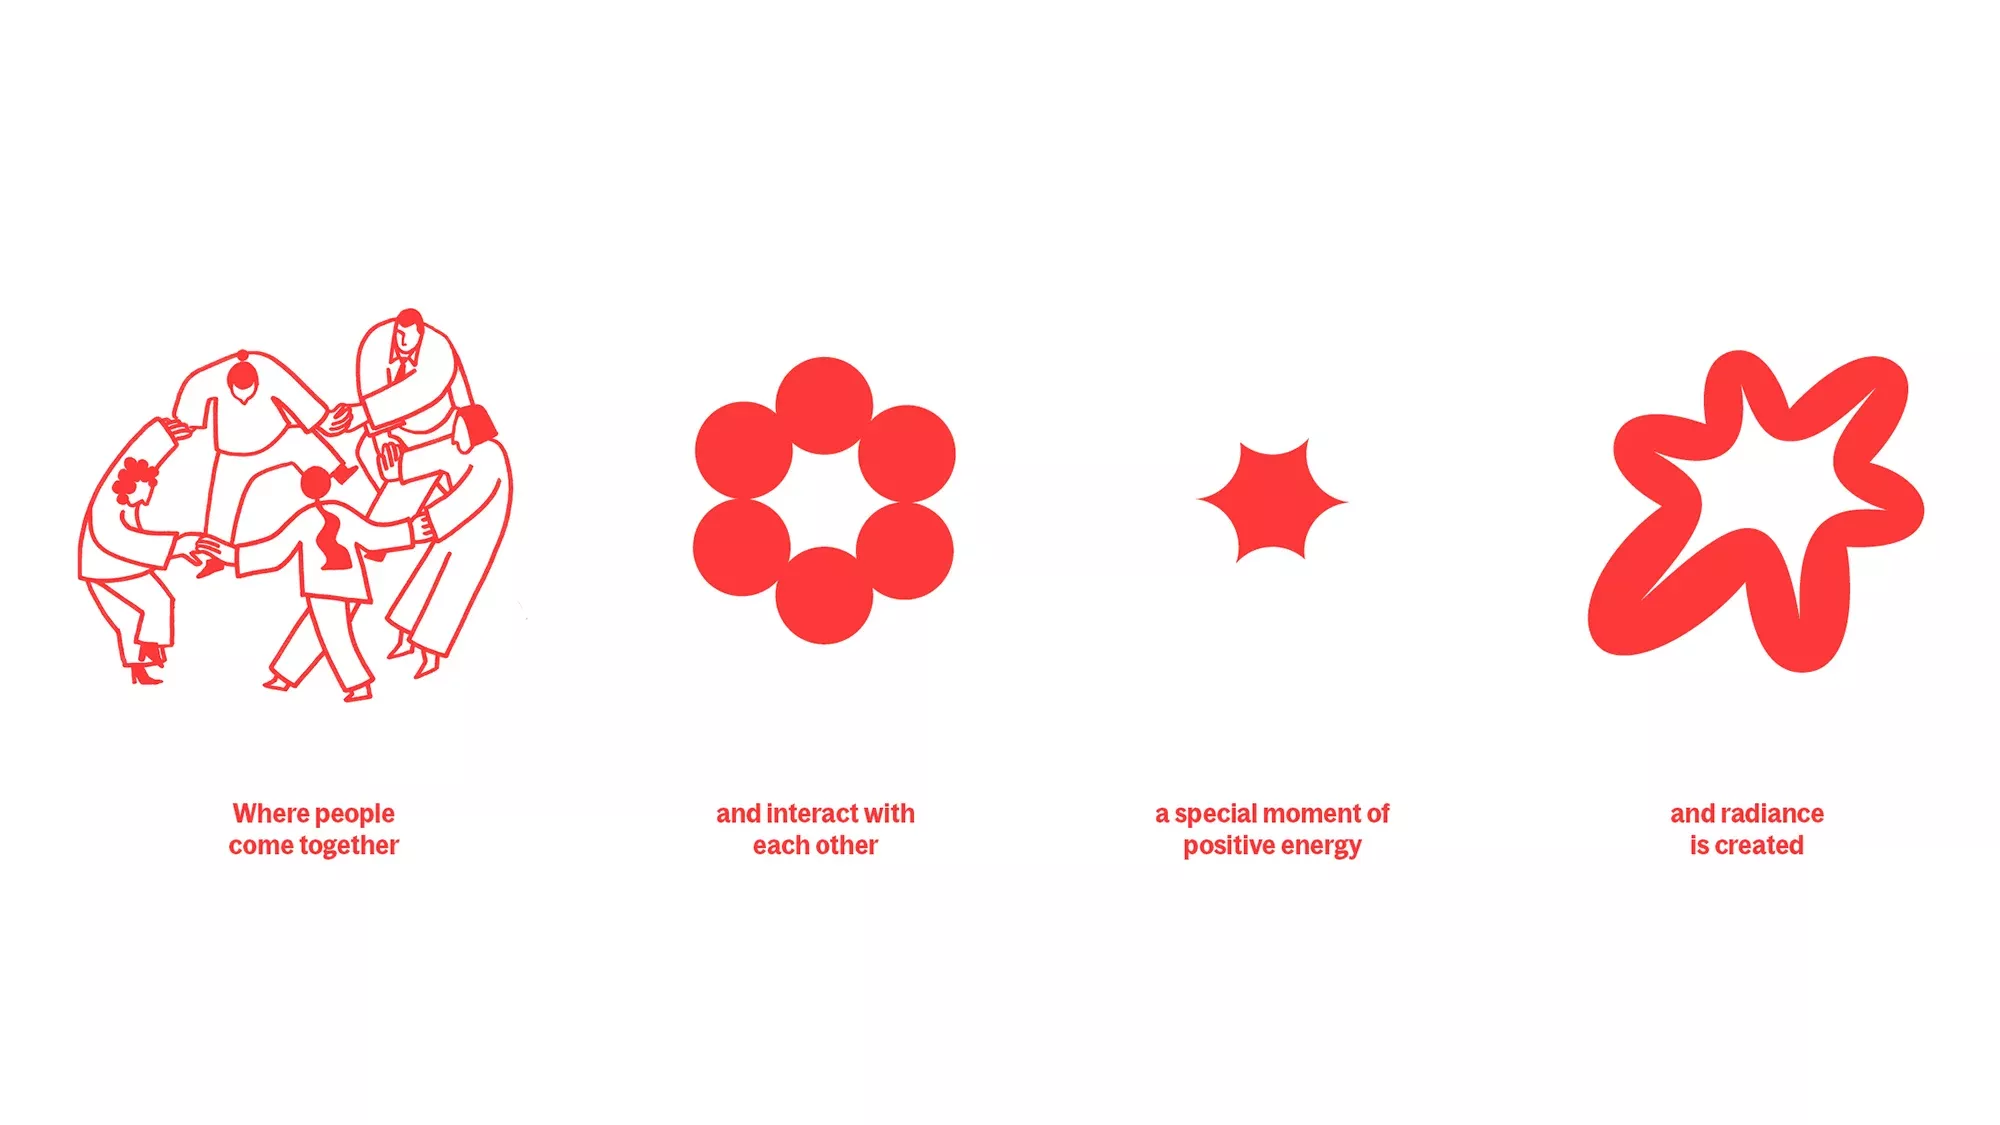
This image presents a minimalist, line-art style infographic illustrating concepts related to community, interaction, energy, and radiance. The design uses simple, bold shapes to convey abstract ideas clearly and cleanly.

This image features a collection of overlapping speech bubbles rendered in a flat, modern design style. The use of varied, warm and cool tones creates a dynamic yet cohesive visual texture suitable for communication or dialogue representation.
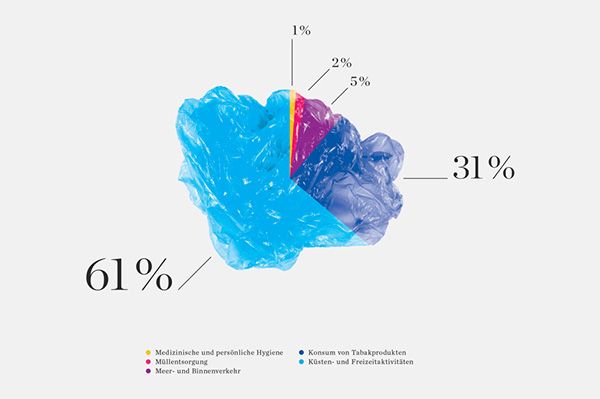
The image is a stylized, abstract representation of a pie chart or segmented area, using translucent, fluid shapes to denote proportions. The design uses vibrant blues and purples to create a dynamic yet somewhat opaque visual hierarchy.
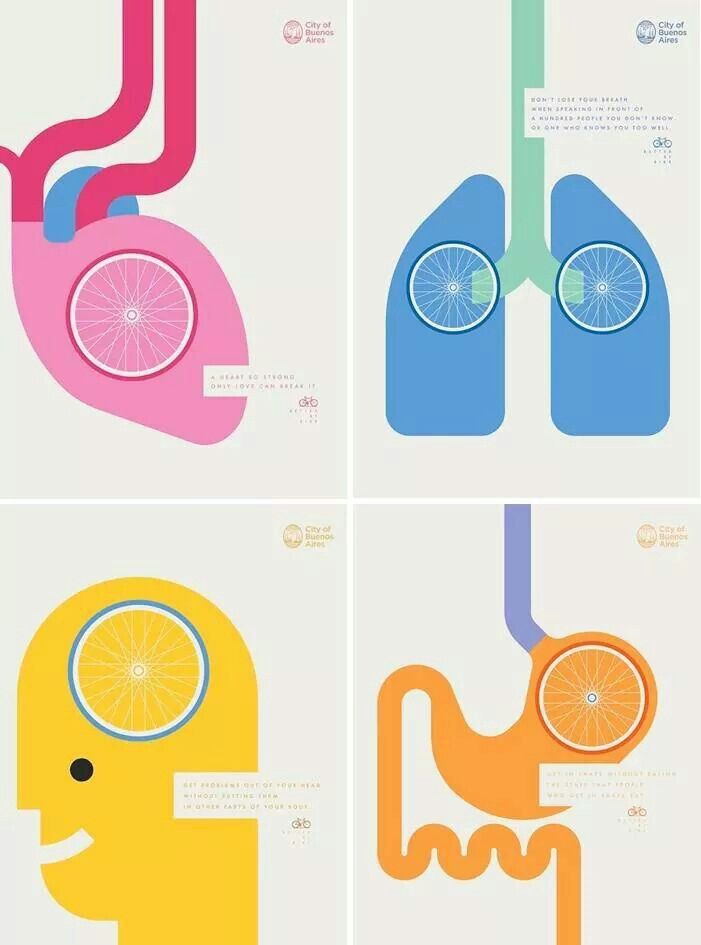
This set of four panels presents a clean, modern, and educational visual style focused on human anatomy, specifically the circulatory and respiratory systems. The design uses simple, flat shapes and a limited color palette to clearly illustrate biological concepts in an accessible manner.
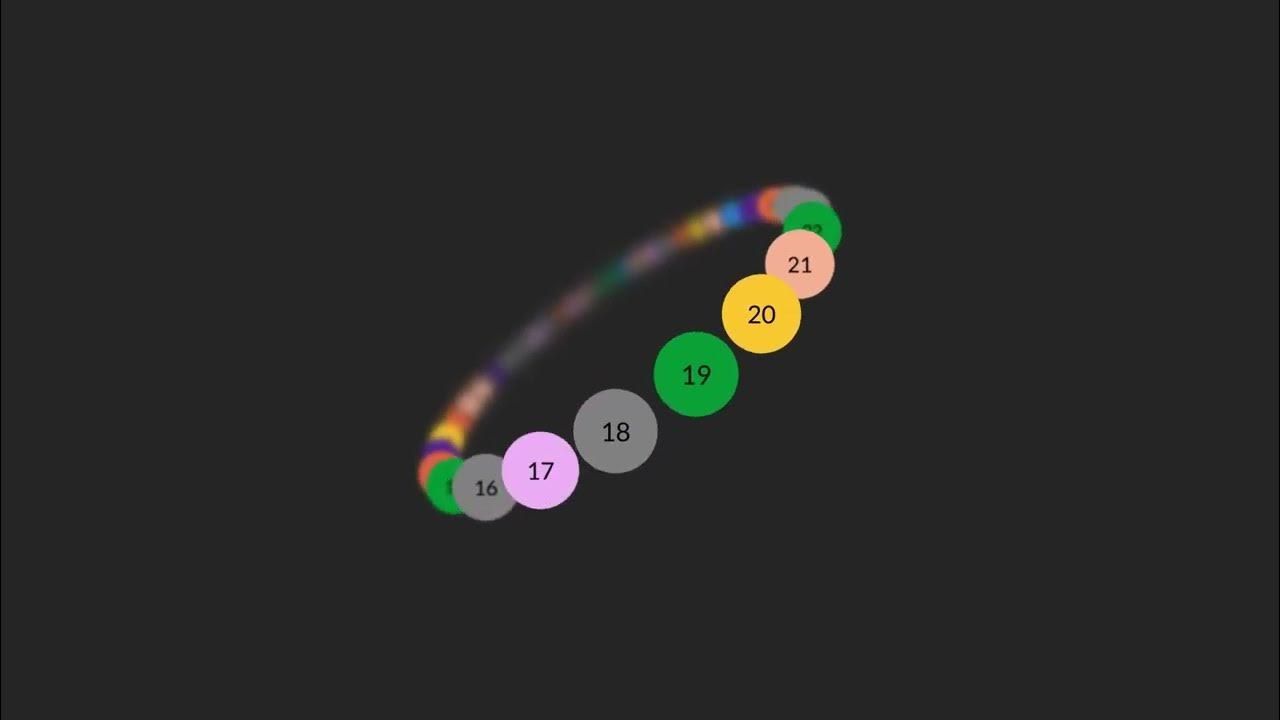
This image presents a minimalist, data-visualization style graphic featuring a sequence of colored circles arranged in an arc. The design is clean and focused, using color variation to denote discrete data points or steps in a progression.

This image is a grid composed of identical, simple geometric icons set against a muted, pastel-like color scheme. The design relies on strong negative space and clear, bold shapes to convey directional information efficiently.
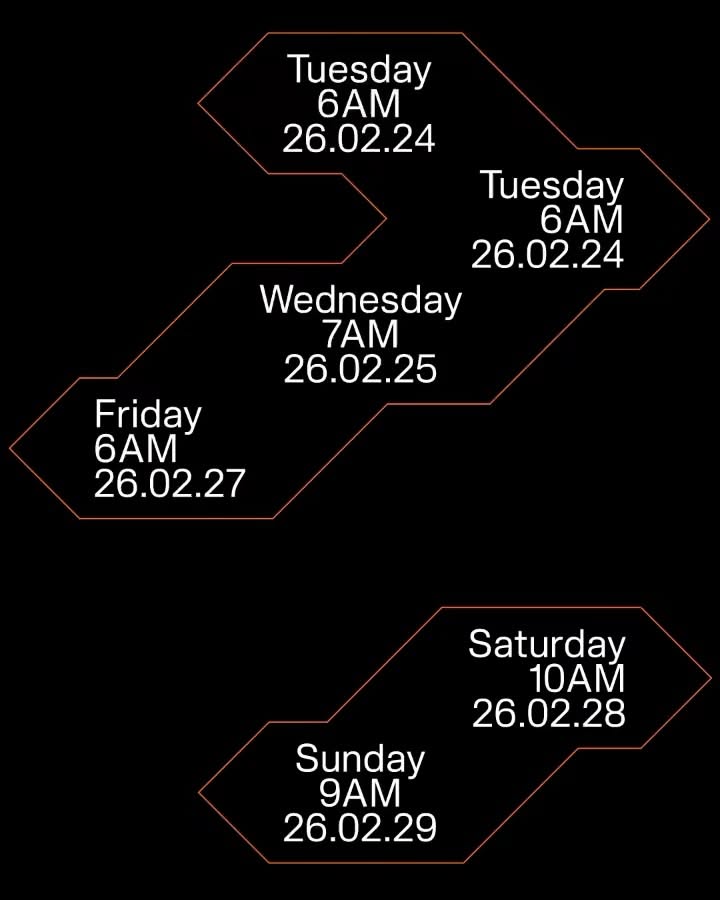
The image presents a minimalist, timeline-like graphic using simple geometric shapes to denote scheduled events. The design relies heavily on negative space and a clean, monochromatic aesthetic to convey information clearly and chronologically.

The image presents a clean, minimalist infographic style using a muted, earthy color palette contrasted with stark white and soft pink accents. The design is highly structured, focusing on presenting large numerical data points related to sports participation in a clear, modern way.
The image presents a clean, minimalist infographic style comparing large numerical data points related to sports participation. It uses a stark contrast between white space and muted, earthy tones to emphasize the statistics.
A minimalist data visualization using vertical striped patterns to represent three distinct time periods or data sets. The design employs a monochromatic black-and-white palette with clean, geometric line work arranged in a centered, vertical composition. The aesthetic is contemporary and information-focused, emphasizing clarity through repetitive visual elements.
A minimalist infographic featuring five stacked rows of red semicircular shapes that progressively blur and fade downward, creating a visual hierarchy of information. The design uses negative space and a subtle gradient effect to convey data degradation or diminishing importance, with small black text labels centered between each pair of shapes.
A minimalist infographic featuring a radial pie chart with white segments arranged in a circular pinwheel pattern against a dark background. Yellow label tags are positioned around the cardinal directions, connected by thin lines to the central diagram, creating a clean, organized data visualization layout.
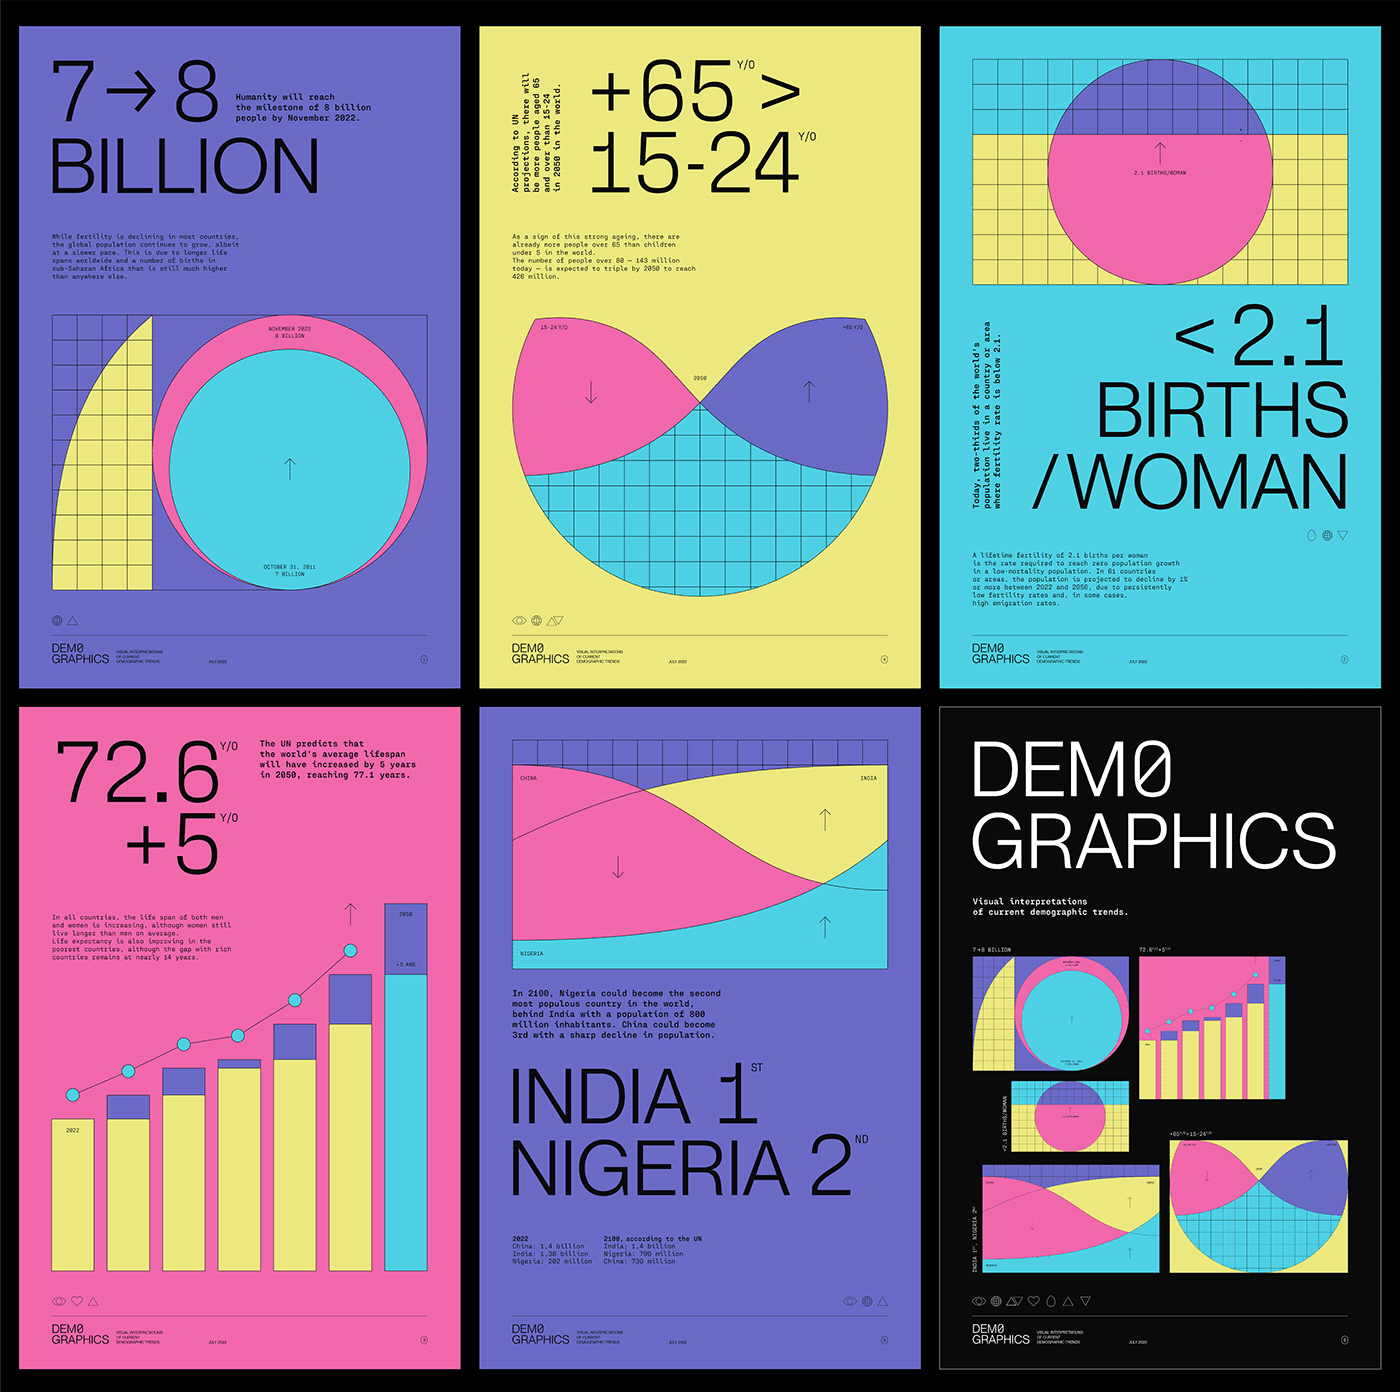
This image presents a series of stark, data-driven graphic design layouts characterized by bold geometric shapes and high-contrast color blocking. The visual language is modern, minimalist, and focused entirely on conveying quantitative information through strong graphical elements.
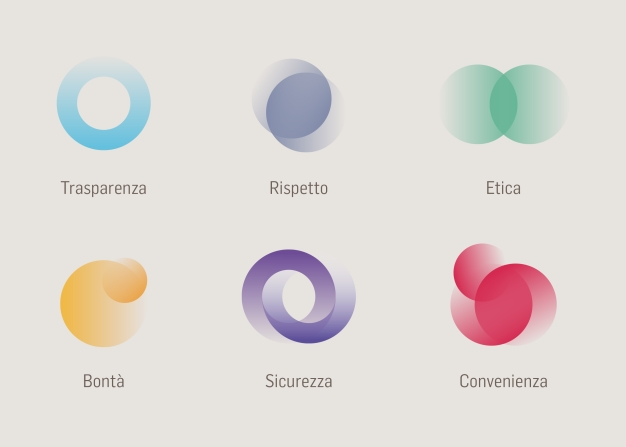
This image presents a clean, minimalist set of six abstract icons or visual concepts arranged in a grid format. The design relies on soft, translucent color gradients and overlapping shapes to symbolize abstract virtues or qualities.
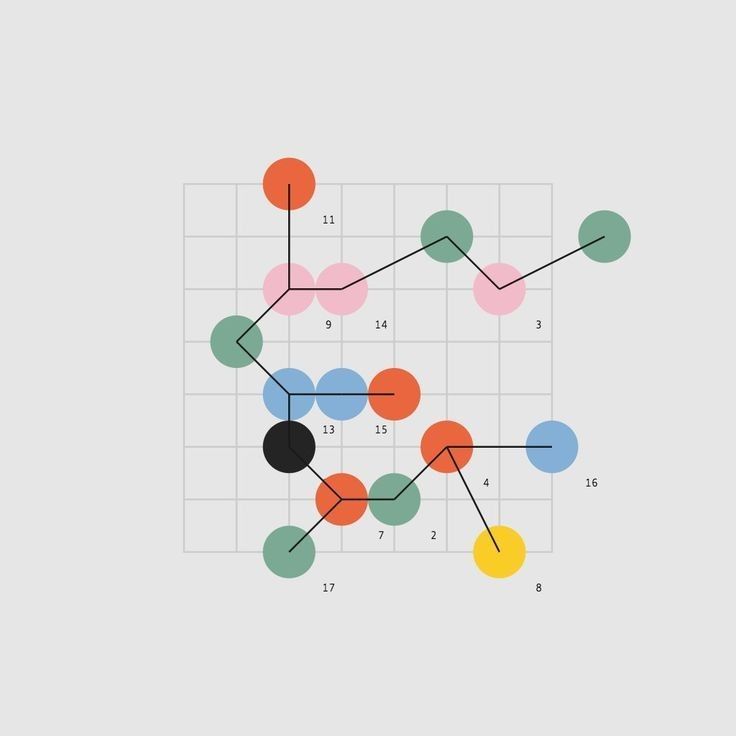
This is a scatter plot visualization using colored circles to represent data points, connected by lines to suggest relationships or sequences. The design is clean and minimalist, relying primarily on color and position to convey information.
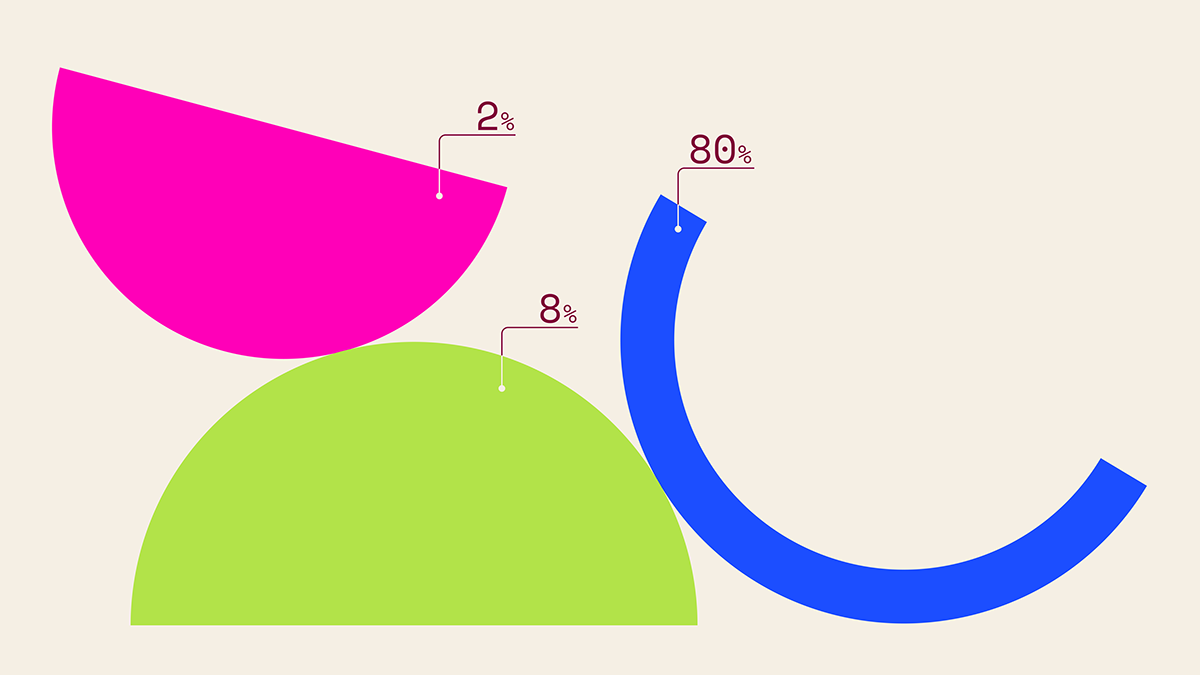
This is a simple, abstract data visualization using large, overlapping geometric shapes to represent proportions. The design relies on bold color blocking and clear percentage callouts to convey quantitative information in a clean, modern manner.